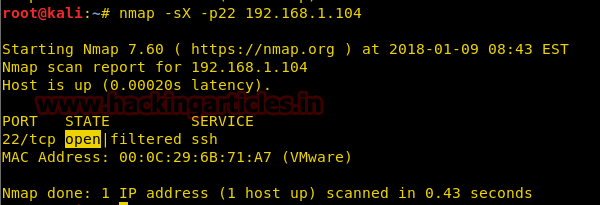
In our previous article we had discussed “
ICMP protocol with Wireshark” where we had seen how an ICMP protocol work at layer 3 according to OSI model and study its result using wireshark. Today we are going discuss to ICMP penetration testing by crafting ICMP packet to test our IDS “Snort” against all ICMP message Types using Cat Karat tool, you can download it from
http://packetbuilder.netlink.
For configuring Snort as IDS read our previous article “
Configure snort in Ubuntu” it will automatically install snort in your system with predefine set of rules that will help in packet capturing of your network.
Let’s start!!
Basically we will perform this practical in three phases as describe below:
Packet crafting:In this phase we will craft each ICMP packet with different type ICMP message using Cat Karat. For more detail about Packet crafting process read our previous
article.
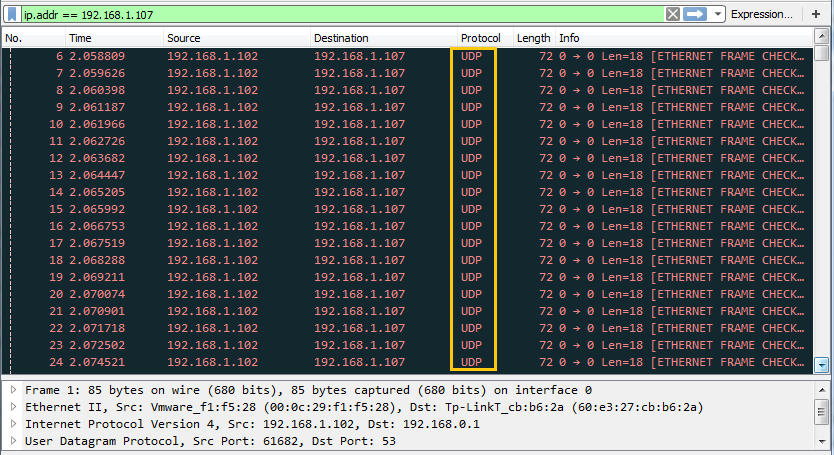
Packet Capturing:In this phase we will capture the ICMP packet and receive an alert when it will enters into target’s network using snort as IDS.
Packet Analysis:In this phase we will investigate captured packet using wireshark.
Brief Introduction on ICMP protocol
ICMP message contains two types of codes i.e. query and error.
Query: The query messages are the information we get from a router or another destination host.
For example given below message types are some ICMP query codes:
· Type 0 = Echo Reply
· Type 8 = Echo Request
· Type 9 = Router Advertisement
· Type 10 = Router Solicitation
· Type 13 = Timestamp Request
· Type 14 = Timestamp Reply
Error: The error statement messages reports problem which a router or a destination host may generate.
For example: given below message types are some of the ICMP error codes:
· Type 3 = Destination Unreachable
· Type 4 = Source Quench
· Type 5 = Redirect
· Type 11 = Time Exceeded
· Type 12 = Parameter Problems
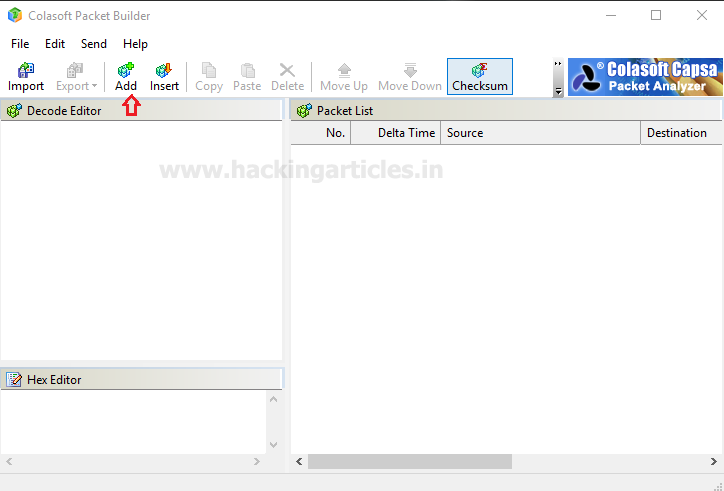
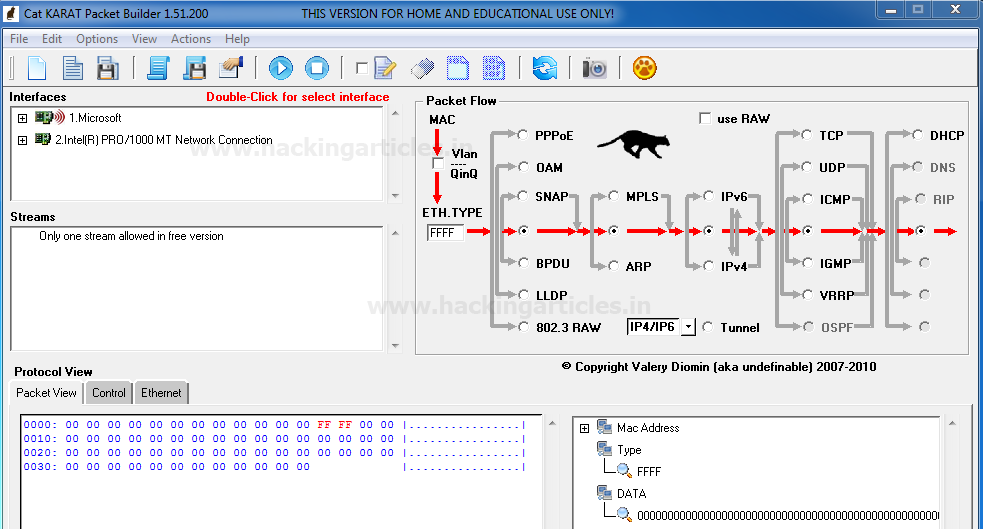
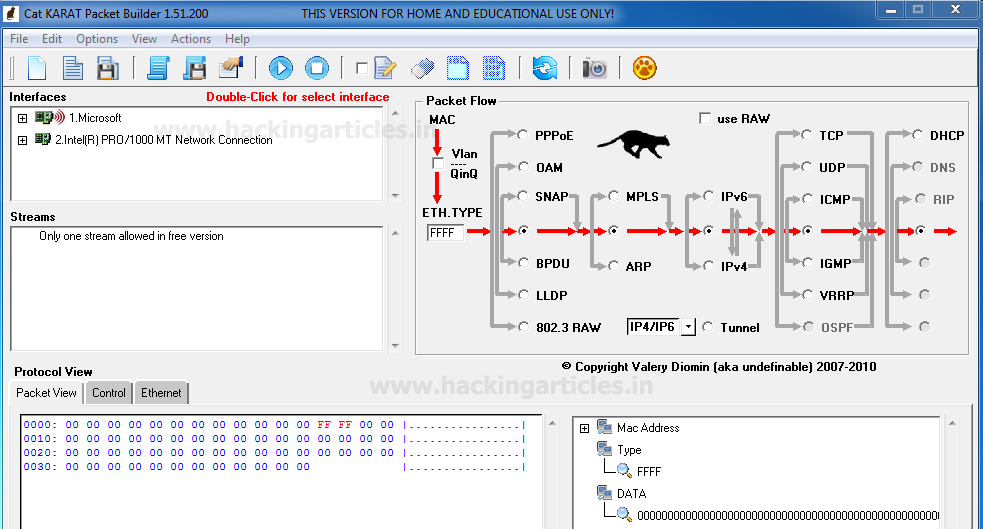
Now when you will run the installed application “Cat KARAT” you will observe three important sections “Interfaces”, “Packet flow” and Packet view which in their default state as shown in given below image.
Message TYPE 0 ICMP Packet Crafting
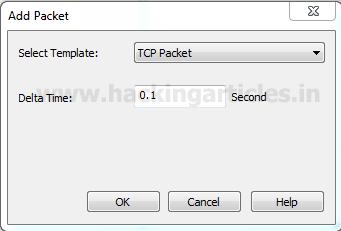
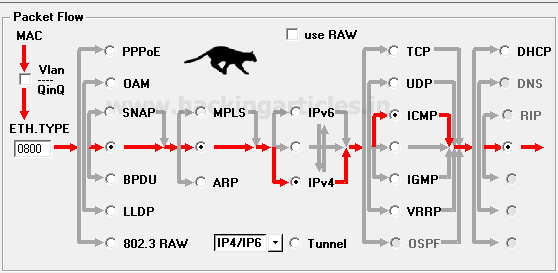
So as we know in Packet Crafting Operation “Packet Assembly” is 1st phase where we need to decide protocol for crafting any packet, which is quite easy to select with this tool. Only enable the radio button for selecting protocol and direction flow of packet. Here I had enable radio buttons for “IPv4” and “ICMP” without disturbing remaining default packet flow as shown given below image.
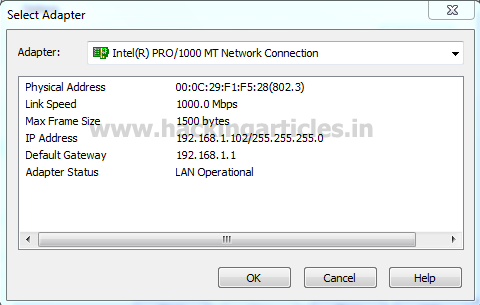
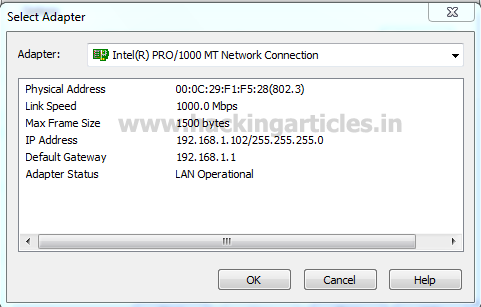
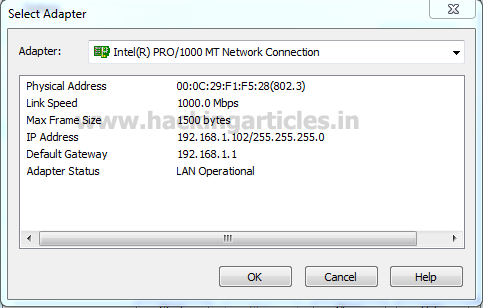
Next we need to select the “interface” which you can select from the Interfaces by double-Click on it.
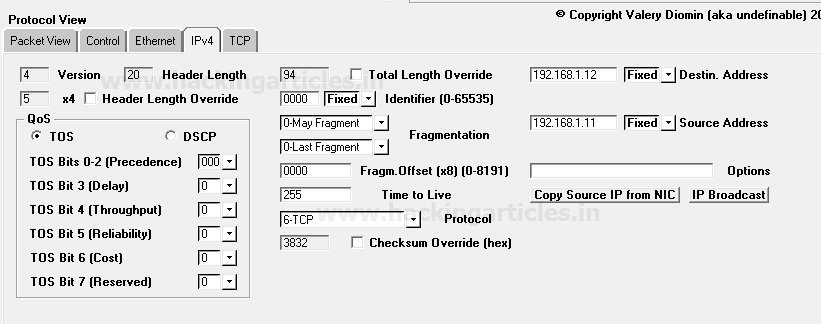
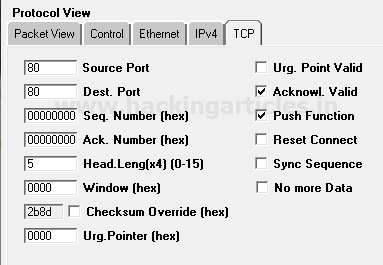
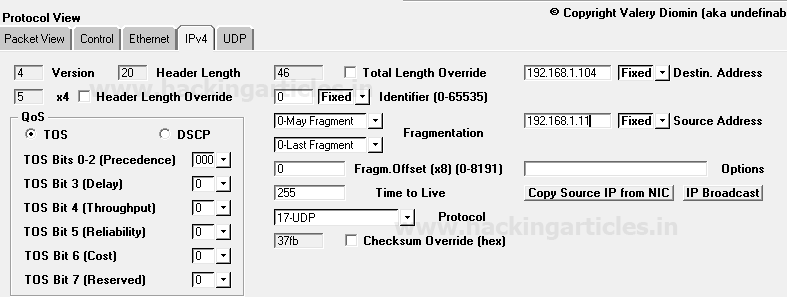
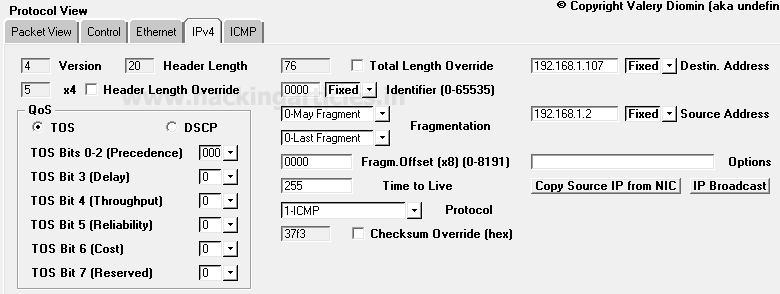
Now next is “packet Editing” phase where you need to specify source IP address such as: 192.168.1.2 from which packet will be sent and Destination IP address such as: 192.168.1.107 on which packet is received. Moreover you can also make some changes in your packet such as Time to live (TTL), Data length and also can go with packet fragmentation.
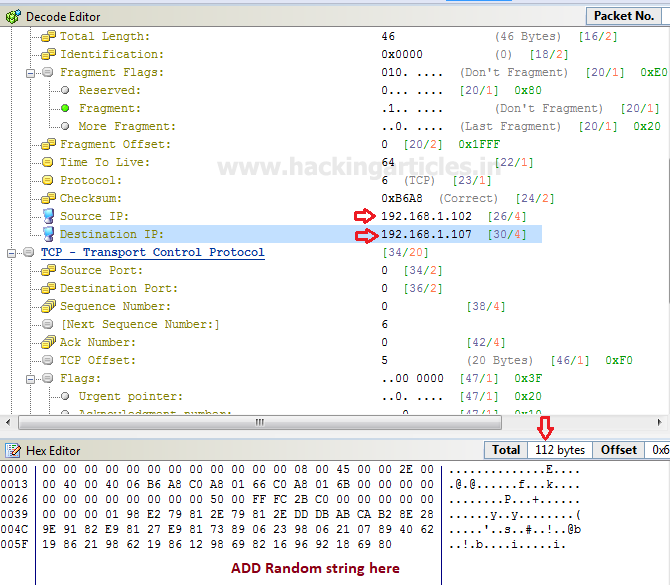
From given below image you can observe I had added source and destination IP in packet under the third section protocol view -> Ipv4
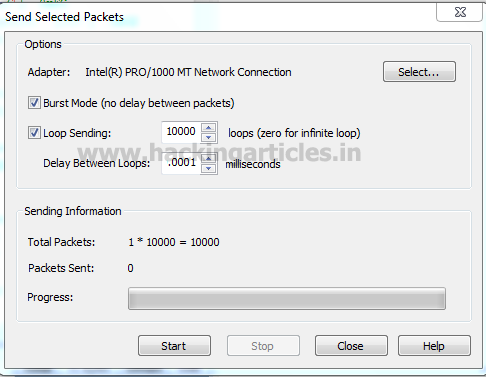
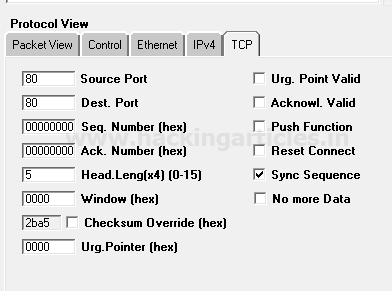
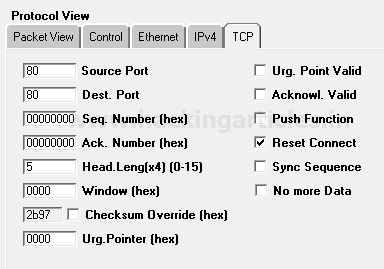
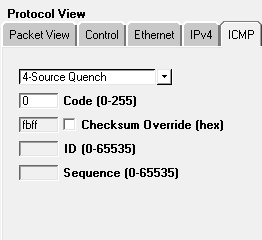
Under 3rd section protocol view in cat Karat explore ICMP tab and select “0-Echo Response” option which is generate type 0 ICMP message. Once everything is edited then your packet is ready to send on target network. Click on play button given in menu bar for sending packet on target’s network which known as “packet playing” phase of packet Crafting operation. This ICMP message type also uses to test the strength of IDS and Firewall against ICMP smurf Dos Attack.
Capturing ICMP-Type0 packet through IDS
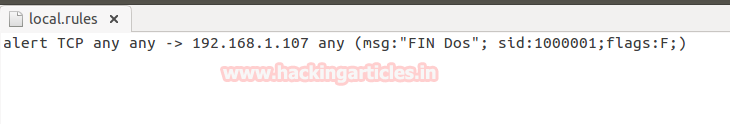
Advantage of install snort through apt respiratory is that, it is quick and easy to install in your system as well as it contains predefine set of rule files related to every type of network traffic either TCP/UDP or ICMP.
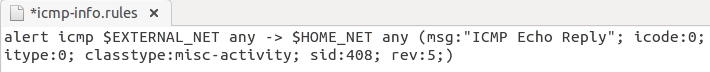
From given below image you can observer that inside the file “icmp-info rules” an alert rule is already implemented for capturing the traffic of ICMP echo Reply packet is found in network. This rule also works against Smurf Dos attack in which ICMP echo reply/response traffic is received on target’s network without sending genuine ICMP request packet from target’s network to other network.
Now turn on IDS mode of snort by executing given below command in terminal:
sudo snort -A console -q -u snort -g snort -c /etc/snort/snort.conf -i eth0
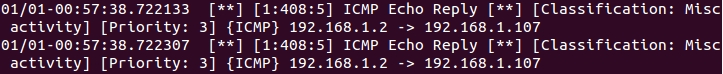
So when IDS received any matching packets defined in file of rules then generate an alert for captured packet. From given below image you can observe that an alert is generated by snort for “ICMP Echo Reply” packets from source address 192.168.1.1.2 to destination 192.168.1.107.
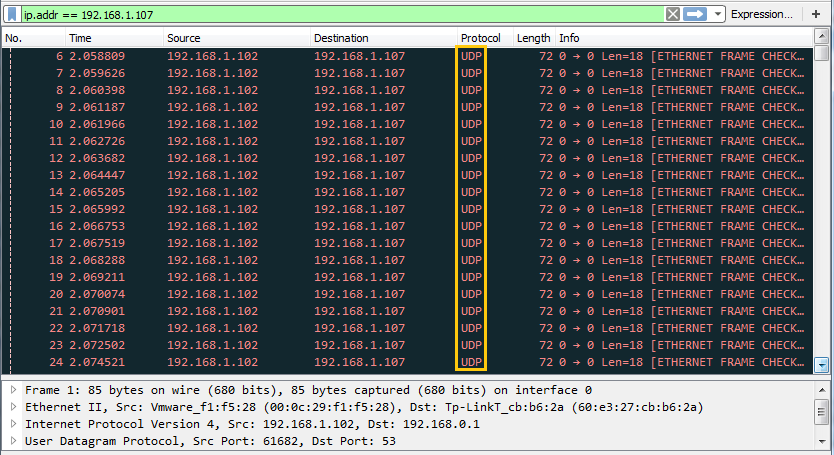
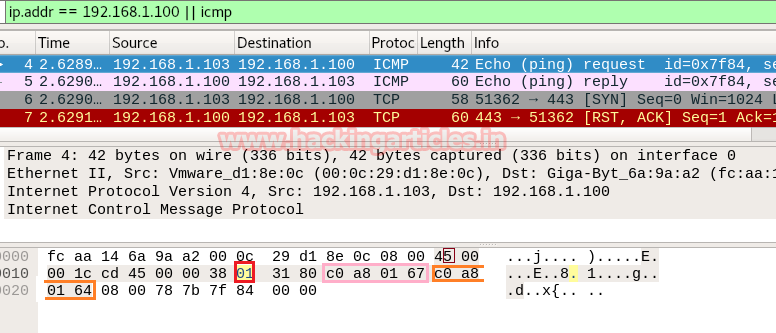
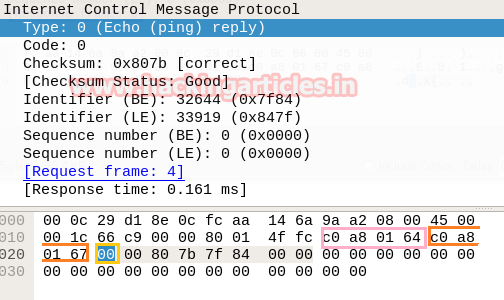
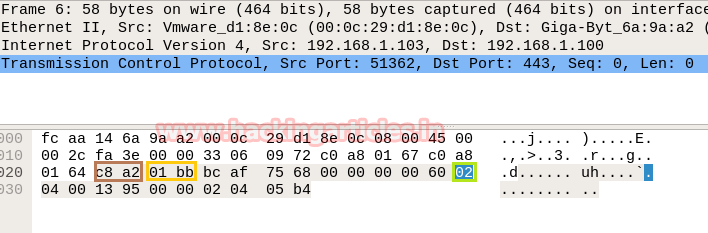
Analysis ICMP-Type0 packet through Wireshark
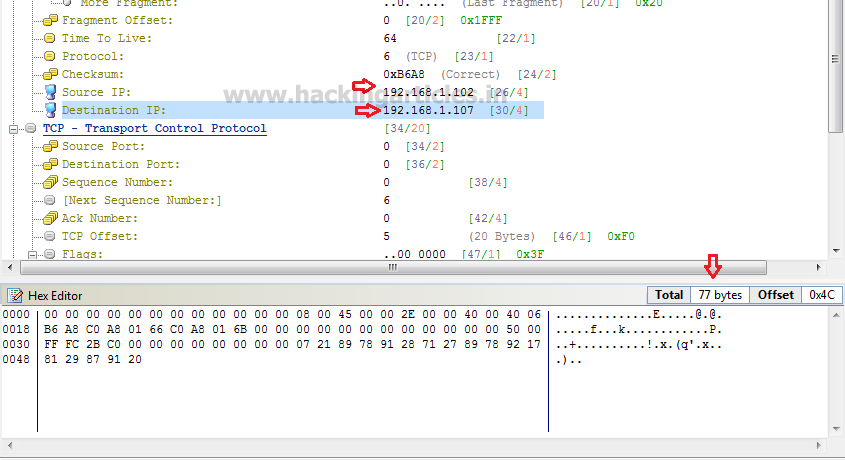
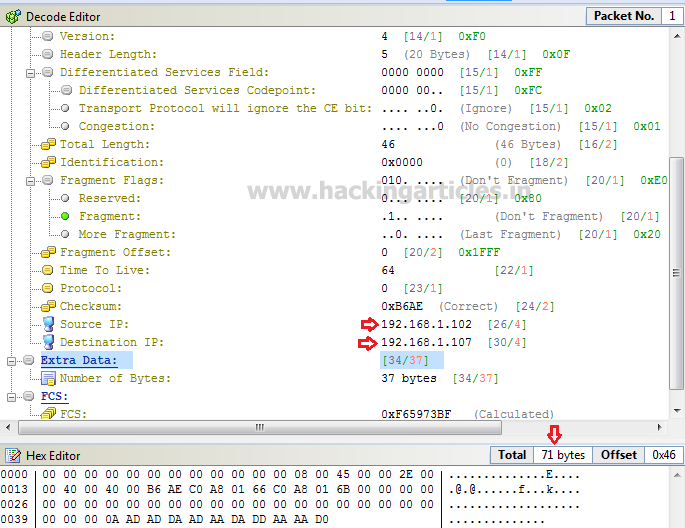
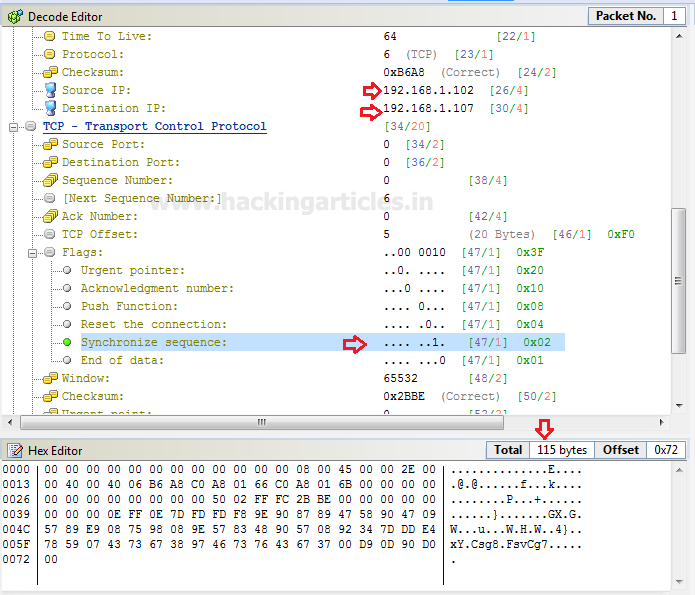
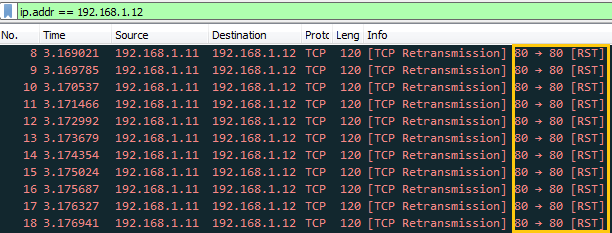
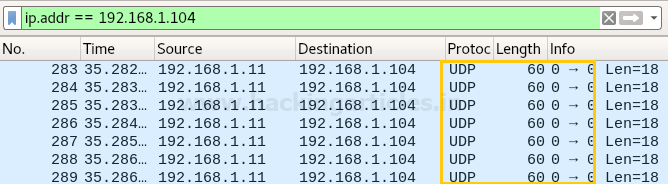
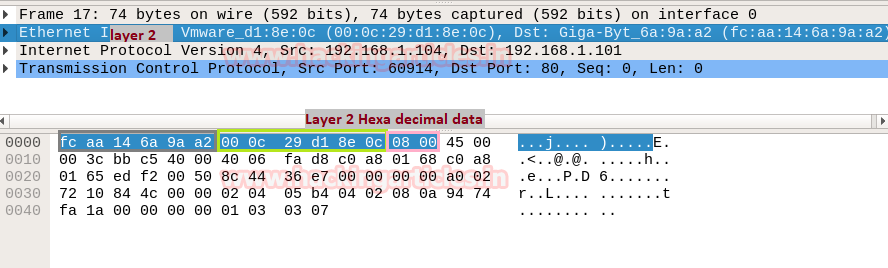
Now Last phase is Packet Analysis which is also last mode of operation of packet crafting process where received packet is analysis using packet analysis tool. Here we had use wireshark for capturing incoming traffic. From given below image you can observe that wireshark has captured exactly same information which we had bind in packet during packet Assembly and packet Editing mode such as ICMP protocol, ICMP message type packet and other information.
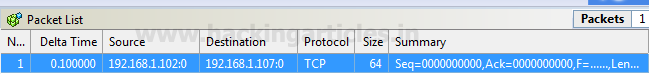
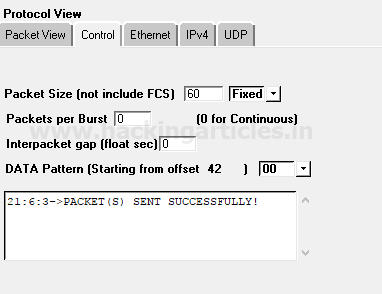
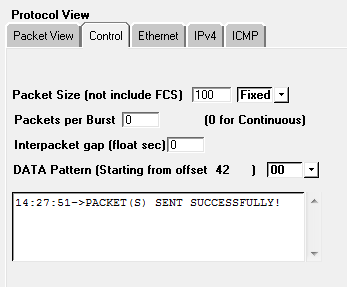
From given below image you can perceive that our ICMP Type 0 is successfully sent on target machine.
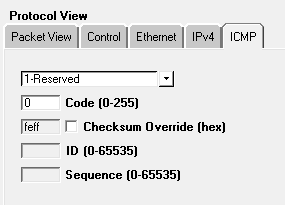
Message TYPE 1 ICMP Packet Crafting
So the Packet Assembly phase and Packet Editing phase for ICMP packet crafting is almost same as above only the difference is make in change ICMP message through which connection will be established with target network.
Since we want to send traffic through message type 1 packets for establishing connection with target network therefore select Type -1 Reserved from given list.
Once everything is edited then your packet is ready to send on target network. Click on play button given in menu bar for sending packet on target’s network which known as “packet playing” phase of packet Crafting operation.
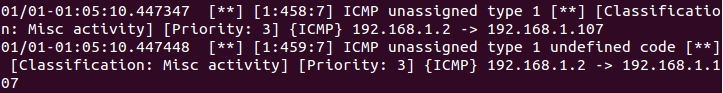
Capturing ICMP-Type1 packet through IDS
From given below image you can observer that inside the file “icmp-info rules” an alert rule is already implemented for capturing the traffic of ICMP unassigned type 1 packet is found in network.
Now turn on IDS mode of snort by executing given below command in terminal:
sudo snort -A console -q -u snort -g snort -c /etc/snort/snort.conf -i eth0
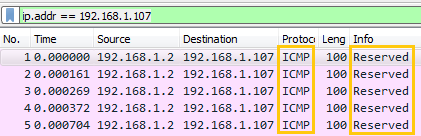
Analysis ICMP-Type1 packet through Wireshark
From given below image you can observe that wireshark has captured exactly same information which we had bind in packet during packet Assembly and packet Editing mode such as ICMP protocol, ICMP message type “Reserved” packets and other information.
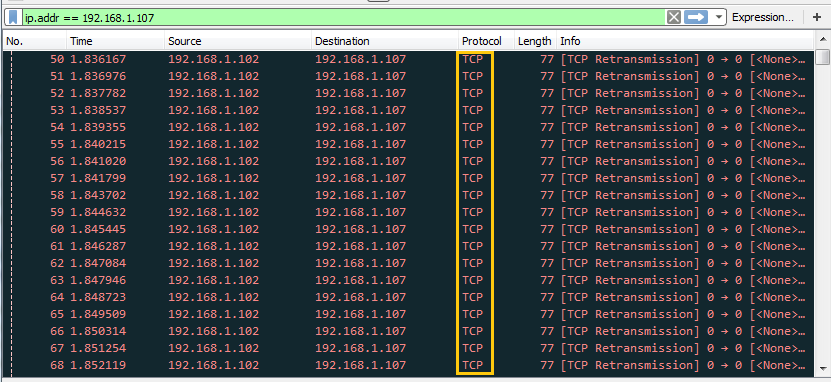
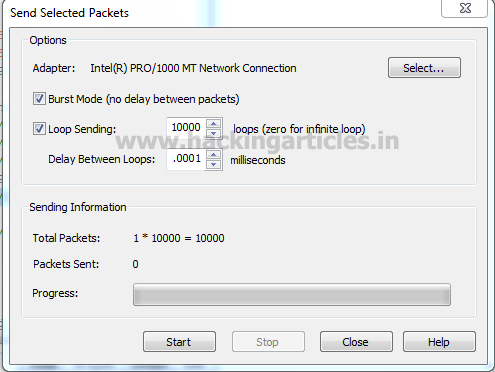
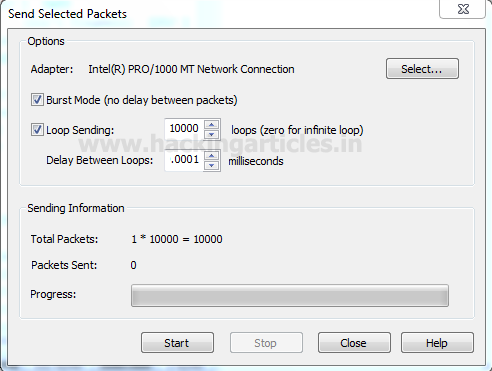
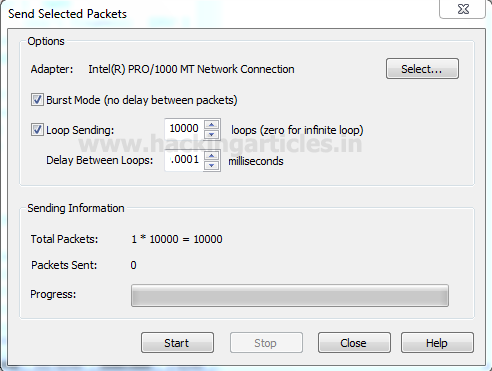
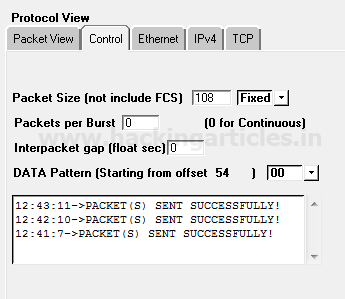
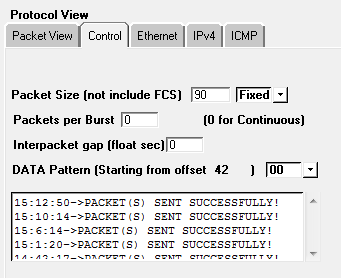
When the tester will click on Stop button, he will receive the status of sent packet either as successful or as failed.
From given below image you can perceive that our ICMP Type 1 is successfully sent on target machine.
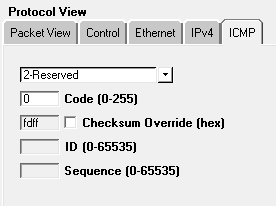
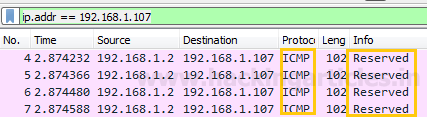
Message TYPE 2 ICMP Packet Crafting
Again the Packet Assembly phase and Packet Editing phase for ICMP packet crafting is almost same as above only the difference is make in change ICMP message through which connection will be established with target network.
Since we want to send traffic through only message type 2 packets for establishing connection with target network therefore select Type 2 Reserved from given list.
Once everything is edited then your packet is ready to send on target network. Click on play button for sending packet on target’s network.
Capturing ICMP-Type2 packet through IDS
From given below image you can observer that inside the file “icmp-info rules” an alert rule is already implemented for capturing the traffic of ICMP unassigned type 2 packet is found in network.
Now turn on IDS mode of snort by executing given below command in terminal:
sudo snort -A console -q -u snort -g snort -c /etc/snort/snort.conf -i eth0
Here also the wireshark has captured exactly same information as per our prediction and fetch same details which we had bind in packet during packet Assembly and packet Editing mode such as ICMP protocol, ICMP message “Reserved” packet and other information.
Again when the tester will click on Stop button, he will receive the status of sent packet either as successful or as failed.
From given below image you can perceive that our ICMP Type 2 is successfully sent on target machine.
Now we want to send traffic through message type 3 packets for establishing connection with target network therefore select Type 3 Destination Unreachable from given list.
Once everything is edited then your packet is ready to send on target network. Click on play button given in menu bar for sending packet on target’s network.
Capturing ICMP-Type3 packet through IDS
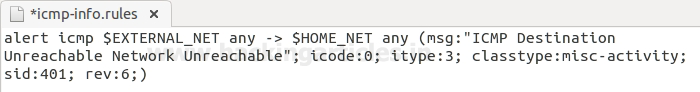
From given below image you can observer that inside the file “icmp-info rules” an alert rule is already implemented for capturing the traffic of ICMP Destination Unreachable Network Unreachable packet when found in network.
Now turn on IDS mode of snort by executing given below command in terminal:
sudo snort -A console -q -u snort -g snort -c /etc/snort/snort.conf -i eth0
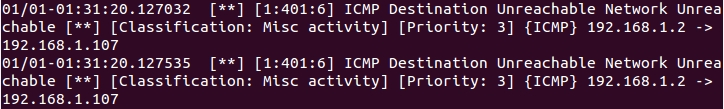
As said above so when IDS received any matching packets defined in file of rules then generate an alert for captured packet. From given below image you can observe that an alert is generated by snort for “ICMP Destination Unreachable Network Unreachable” packets from source address 192.168.1.1.2 to destination 192.168.1.107.
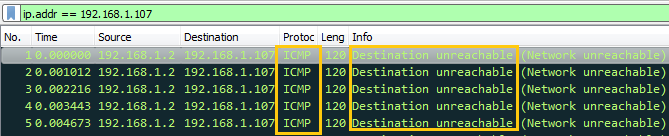
Analysis ICMP-Type3 packet through Wireshark
From given below image you can observe that wireshark has captured exactly same information which we had bind in packet during packet Assembly and packet Editing mode such as ICMP protocol, ICMP message type “Destination Unreachable” (Network Unreachable) packet and other information.
Again when the tester will click on Stop button, he will receive the status of sent packet either as successful or as failed.
From given below image you can perceive that our ICMP Type 3 is successfully sent on target machine.
So the Packet Assembly phase and Packet Editing phase for ICMP packet crafting is almost same as above only the difference is make in change ICMP message through which connection will be established with target network.
Since we want to send traffic through message type 4 packets for establishing connection with target network therefore select Type 4 Source Quench from given list.
Once everything is edited then your packet is ready to send on target network. Click on play button given in menu bar for sending packet on target’s network which known as “packet playing” phase of packet Crafting operation.
Capturing ICMP-Type4 packet through IDS
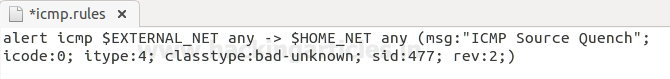
From given below image you can observer that inside the file “icmp-info rules” an alert rule is already implemented for capturing the traffic of ICMP Source Quench packet when found in network.
Now turn on IDS mode of snort by executing given below command in terminal:
sudo snort -A console -q -u snort -g snort -c /etc/snort/snort.conf -i eth0
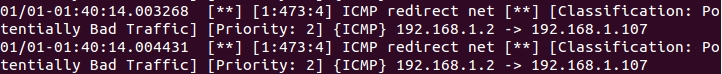
So when IDS received any matching packets defined in file of rules then generate an alert for captured packet. From given below image you can observe that an alert is generated by snort for “ICMP Source Quench” packets from source address 192.168.1.1.2 to destination 192.168.1.107.
Analysis ICMP-Type4 packet through Wireshark
Here also the wireshark has captured exactly same information as per our prediction and fetch same details which we had bind in packet during packet Assembly and packet Editing mode such as ICMP protocol, ICMP message type “Source quench” packet and other information.
Again when the tester will click on Stop button, he will receive the status of sent packet either as successful or as failed.
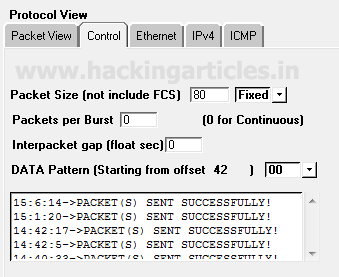
From given below image you can perceive that our ICMP Type 4 is successfully sent on target machine.
Message TYPE 5 ICMP Packet Crafting
We want to send traffic through message type 5 packets for establishing connection with target network therefore select Type 5 Redirect from given list.
Once everything is edited then your packet is ready to send on target network. Click on play button given in menu bar for sending packet on target’s network.
Capturing ICMP-Type5 packet through IDS
As given in below image you can observer that inside the file “icmp-info rules” an alert rule is already implemented for capturing the traffic of ICMP redirect net packet when found in network.
Now turn on IDS mode of snort by executing given below command in terminal:
sudo snort -A console -q -u snort -g snort -c /etc/snort/snort.conf -i eth0
Again as per our prediction wireshark has captured exactly same information which we had bind in packet during packet Assembly and packet Editing mode such as ICMP protocol, ICMP message type “redirect” packet and other information.
From given below image you can perceive that our ICMP Type 5 is successfully sent on target machine.
So the Packet Assembly phase and Packet Editing phase for ICMP packet crafting is almost same as above only the difference is make in change ICMP message through which connection will be established with target network.
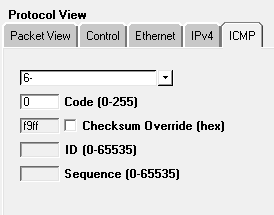
Here now next we want to send traffic through message type 6 packets for establishing connection with target network therefore select Type 6 for Alternate Host Addressfrom given list.
Once everything is edited then your packet is ready to send on target network. Click on play button given in menu bar for sending packet on target’s network.
Capturing ICMP-Type6 packet through IDS
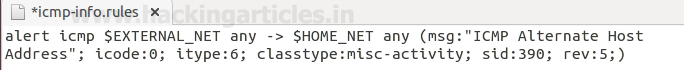
From given below image you can observer that inside the file “icmp-info rules” an alert rule is already implemented for capturing the traffic of ICMP Alternate Host Address packet is found in network.
Now turn on IDS mode of snort by executing given below command in terminal:
sudo snort -A console -q -u snort -g snort -c /etc/snort/snort.conf -i eth0
So when IDS received any matching packets defined in file of rules then generate an alert for captured packet. From given below image you can observe that an alert is generated by snort for “ICMP Alternate Host Address” packets from source address 192.168.1.1.2 to destination 192.168.1.107.
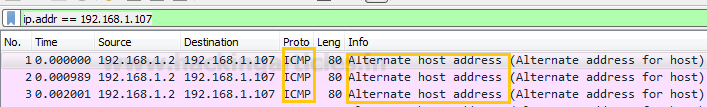
Analysis ICMP-Type6 packet through Wireshark
From given below image you can observe that wireshark has captured exactly same information which we had bind in packet during packet Assembly and packet Editing mode such as ICMP protocol, ICMP message type “Alternate Host Address” packet and other information.
Again when the tester will click on Stop button, he will receive the status of sent packet either as successful or as failed.
From given below image you can perceive that our ICMP Type 6 is successfully sent on target machine.
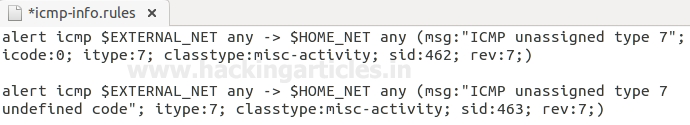
Message TYPE 7 ICMP Packet Crafting
Again Repeat the same and send traffic through message type 7 packets for establishing connection with target network therefore select Type 7 for Unassignedfrom given list.
Once everything is edited then your packet is ready to send on target network. Click on play button given in menu bar for sending packet on target’s network.
From given below image you can observer that inside the file “icmp-info rules” an alert rule is already implemented for capturing the traffic of ICMP Alternate Host Address packet is found in network.
Now turn on IDS mode of snort by executing given below command in terminal:
sudo snort -A console -q -u snort -g snort -c /etc/snort/snort.conf -i eth0
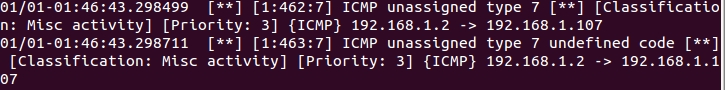
Therefore when IDS received any matching packets described in file of rules then it will generate an alert for captured packet. From given below image you can observe that an alert is generated by snort for “ICMP unassigned type 7” packets from source address 192.168.1.1.2 to destination 192.168.1.107.
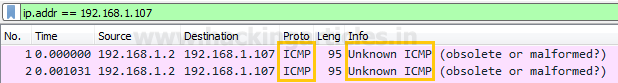
Wireshark has captured exactly same information which we had bind in packet during packet Assembly and packet Editing mode such as ICMP protocol, ICMP unknown message type “obsolete or malformed” packet and other information.
Again when the tester will click on Stop button, he will receive the status of sent packet either as successful or as failed.
From given below image you can perceive that our ICMP Type 7 is successfully sent on target machine.
Message TYPE 8 ICMP Packet Crafting
Since we want to send traffic through message type 8 packets for establishing connection with target network therefore select Type 8 for ICMP echo Request from given list.
This step is very useful because it will craft a packet will send ICMP Request packet on target’s network to test the strength of IDS and Firewall.
Infinite packet ICMP Request packet is consider as ICMP Flood or Ping of Death Attack when sent only network therefore we can check our IDS and Firewall Strength against such DOS attack through this packet crafting.
Once everything is edited then your packet is ready to send on target network. Click on play button given in menu bar for sending packet on target’s network.
Capturing ICMP-Type8 packet through IDS
From given below image you can observer that inside the file “icmp-info rules” an alert rule is already implemented for capturing the traffic of ICMP Ping packet is found in network. As we know ICMP echo Request packet is consider as Ping request packet which sends request to a network IP for establishing connection with it.
Now turn on IDS mode of snort by executing given below command in terminal:
sudo snort -A console -q -u snort -g snort -c /etc/snort/snort.conf -i eth0
Analysis ICMP-Type8 packet through Wireshark
From given below image you can observe that wireshark has captured Ping packet for ICMP Echo request as described above, exactly same information which we had bind in packet such as ICMP protocol, ICMP Ping request message packet and other information.
Again when the tester will click on Stop button, he will receive the status of sent packet either as successful or as failed.
From given below image you can perceive that our ICMP Type 8 is successfully sent on target machine.
Message TYPE 9 ICMP Packet Crafting
Now at last we want to send traffic through message type 9 packets for establishing connection with target network therefore select Type 9 for router Advertisement from given list.
Once everything is edited then your packet is ready to send on target network. Click on play button given in menu bar for sending packet on target’s network.
Capturing ICMP-Type9 packet through IDSFrom given below image you can observer that inside the file “icmp-info rules” an alert rule is already implemented for capturing the traffic of ICMProuter Advertisement packet is found in network.
Now turn on IDS mode of snort by executing given below command in terminal:
sudo snort -A console -q -u snort -g snort -c /etc/snort/snort.conf -i eth0
So when IDS received any matching packets defined in file of rules then generate an alert for captured packet. From given below image you can observe that an alert is generated by snort for “ICMP router Advertisement” packets from source address 192.168.1.1.2 to destination 192.168.1.107.
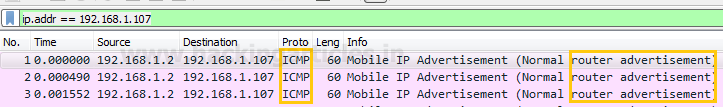
Analysis ICMP-Type9 packet through Wireshark
From given below image you can observe that wireshark has captured exactly same information which we had bind in packet during packet Assembly and packet Editing mode such as ICMP protocol, ICMP PICMP router Advertisementmessage packet and other information.
Again when the tester will click on Stop button, he will receive the status of sent packet either as successful or as failed.
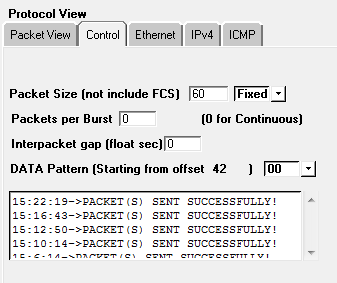
From given below image you can perceive that our ICMP Type 9 is successfully sent on target machine.