VULS is an open-source agentless vulnerability scanner that is written In GO Language for Linux Systems. For server Administrator having to perform software updates and security vulnerability analysis daily can be a burden. VULS can be useful or helpful to automate Vulnerability Analysis and to Avoid the burden of manually performing of Vulnerability analysis of the software installed on the system. It uses multiple Vulnerability databases, such as Metasploit, Exploit DB, NVD (National Vulnerability Database).
Table of content
· Vuls
§ Key Features
§ Architecture
· Prerequisites
· Installation & Configuration of Dependencies
§ Installing Dependencies
§ Installation & Configuration of GO-CVE-Dictionary
§ Installation & Configuration of Goval-Dictionary
§ Installation & Configuration of Gost
· Install and Configure VULS
§ Install and configure VULS repo (GUI) Server
§ Requirements
§ Installation
§ Usage
§ DigestAuth
§ Configuration of TOML file
· Running Local Scan
· Scanning Multiple Remote Host systems
Vuls Feature & Architecture
Key Features
· VULS provides a way of automating Vulnerability for Linux packages
· VULS can be installed on all Linux based distros for example: - Linux, Ubuntu, Debian, FreeBSD, CentOS, Solaris, and so on…
· VULS has the ability to scan multiple systems at a single time by using SSH protocol and to send reports via Slack or Email.
· VULS uses three Scan modes Fast, Fast Root, and Deep you can select according to Situation or as per your requirements.
· Scan results can be Viewed by using TUI (Terminal user interface) and GUI (Graphical user interface).
· When generating reports VULS prioritizes High Severity Vulnerabilities using an established ranking system from Database.
Architecture
Fast Scan: - It performs scans without root privilege, No dependencies, almost no load on the scan target server.
Fast-root Scan: - It performs scans with root privilege, no dependencies, almost no load on the scan target server.
Deep Scan: - It performs a scan with root privilege, containing all dependencies, almost full load on scan target server.
Offline Scan Mode: - Fast, Fast-root, and Deep have Offline Scan Mode. VULS can Scan with no internet access with offline scan mode.
Now we see how to install and Configure VULS as a Vulnerability scanner for further investigations.
Let’s take a look 🤔!!
Prerequisites
To configure VULS in your Ubuntu platform, there are some prerequisites required for installation.
§ Ubuntu 20.04.1 with minimum 4GB RAM and 2 CPU
§ SSH Access with Root Privileges
§ Firewall Port: - 5111
§ Multiple servers running (ubuntu 20.04 or any vulnerable server) if you want to set up VULS to scan remotely.
Installation & Configuration of Dependencies
Let’s begin the installation process
Note: - The whole installation process will take a long time to finish so make your self comfortable and begin the installation process.
Installing Dependencies
In this section, we’re going to create a folder Vuls-data. VULS uses SQLite to store their vulnerability information so, that we’re going to install SQLite, Go programming language, and other dependencies.
We are going to store all VULS related data in the /usr/share/vuls-data directory. To create it run the following as described below.
mkdir /usr/share/vuls-data
Now we have created vuls-data folder where we are going to store all data, and this will be our workspace before getting started let’s install the required dependencies.
Now, we’re going to install
· SQLite: -VULS uses SQLite to store its vulnerability information.
· Debian-goodies: - it is the check restart utility that provides the information which package needs to be restarted in any moment.
· GCC: - GNU compiler collection is a compiler system. GCC is a toolchain and the standard compiler for Unix-like systems.
· Wget
· Make: -Make is used to detect automatically which part of a large program need to be recompiled and issue the commands to recompile them.
Install all dependencies by using the following command.
apt install sqlite git debian-goodies gcc make wget
now you have installed the required dependencies Next, install GO using snap package manager by issuing the following command
snap install go --classic
Next, you need to set up a few environment variables for Go that specifies the working directory for Go.
To prevent from setting these variables every time the user logs on you need to automate this process by creating an executable file go-env.sh under /etc/profile.d. This will execute the directory every time the users log on. To automate this process, follow the below commands.
nano /etc/profile.d/go-env.sh
Add the following commands to the file:
export GOPATH=$HOME/go
export PATH=$PATH:$GOPATH/bin:/snap/bin
Still go-env.sh file is not executable. Make it executable by running by changing the permission of that file or directly running by the following command.
chmod +x /etc/profile.d/go-env.sh
And then reload the environment variables by running the following command.
source /etc/profile.d/go-env.sh
Installation & Configuration of Go-CVE-dictionary
Let’s download and install go-cve-dictionary. The go-cve-dictionary is a tool that provides access to NVD (National Vulnerability Database). NVD is the US government repository of publicly reported cybersecurity vulnerabilities, that contains vulnerability IDs (CVE — Common Vulnerabilities and Exposures), summaries, and impact analysis, and is available in a machine-readable format. You can access the NVD using the Go package. Then you’ll need to run and fetch vulnerability data for VULS to use.
Let’s install Go-cve-dictionary under $GOPATH/src/ by cloning GO packages from GitHub which is made by Kotakanbe and compiling it afterward.
Let’s start it by creating a directory where to store Go-cve-dictionary by running the following command.
mkdir -p $GOPATH/src/github.com/Kotakanbe
Navigate to it and clone g0-cve-dictionary from GitHub by issuing the following command
cd $GOPATH/src/github.com/kotakanbe
git clone https://github.com/kotakanbe/go-cve-dictionary.git
And then navigate to the cloned package further then start installation.
cd go-cve-dictionary
make install
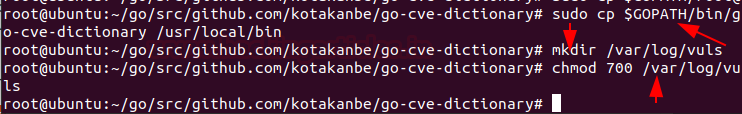
Further then, make it available wide into your system copy It to /usr/local/bin by running below command.
cp $GOPATH/bin/go-cve-dictionary /usr/local/bin
go-cve dictionary requires a log output directory and logs are generally created under /var/logs/.
Let’s create a directory for go-cve-dictionary and the log directory is readable by everyone restrict to current user by issuing following command.
mkdir /var/log/vuls
chmod 700 /var/log/vuls
Now fetch vulnerability data from NVD and store it to VULS workspace under /usr/share/vuls-data:
for i in `seq 2014 $(date +"%Y")`; do sudo go-cve-dictionary fetchnvd -dbpath /usr/share/vuls-data/cve.sqlite3 -years $i; done
In my case I’m cloning the cve database from the year 2014 this will download the NVD data from 2014 to the current year you can clone or download data as desired year as you want.
NOTE: - This command will take a long time to finish, till then go get served you with a Coffee ☕.
Installation & Configuration of goval-dictionary
Let’s download and install “goval-dictionary”. The goval-dictionary is a tool that will copy the OVAL (Open Vulnerability and Assessment Language) which is an open language used to express checks for determining whether software vulnerabilities exist on a given system and provides access to the OVAL database for Ubuntu.
The goval-dictionary is also written by Kotakanbe so, install goval-dictionary in the same folder that previously you created under “$GOPATH/src/github.com/Kotakanbe” and then clone the Package from the GitHub by running the following command.
cd $GOPATH/src/github.com/kotakanbe
git clone https://github.com/kotakanbe/goval-dictionary.git
And then navigate to the cloned package further then compile or install it with “make” by running the following command.
cd goval-dictionary
make install
Copy it to /usr/local/bin to make it globally accessible and then after that Fetch the OVAL data for Ubuntu 20.x or another version as per your requirement by running the following command.
cp $GOPATH/bin/goval-dictionary /usr/local/bin
goval-dictionary fetch-ubuntu -dbpath=/usr/share/vuls-data/oval.sqlite3 20
Installation & Configuration of gost
Let’s download and install “gost”. Gost is a Debian security Bug tracker that collects all information about the vulnerability status of packages distributed with Debian and provides access to the Debian security bug tracker database.
Let’s install this package into a new folder by running the following command:
mkdir -p $GOPATH/src/github.com/knqyf263
Navigate to the folder just you have created after that, clone the gost packages from GitHub, and then make install by running the following command:
cd $GOPATH/src/github.com/knqyf263
sudo git clone https://github.com/knqyf263/gost.git
After it finishes entering to the cloned package than “make install”
cd gost
make install
Don’t forget to make it accessible globally and then link its database to the /usr/share/vuls-data by running following command:
cp $GOPATH/bin/gost /usr/local/bin
ln -s $GOPATH/src/github.com/knqyf263/gost/gost.sqlite3 /usr/share/vuls-data/gost.sqlite3
Create a log file directory for gost it requires access to the log output directory and then restrict access to the current user by using the following command:
mkdir /var/log/gost
chmod 700 /var/log/gost
And then, fetch the Debian security tracker data by issuing the following command:
gost fetch debian
Install & Configure VULS
We have installed all required Dependencies of VULS. Now you can download and install Vuls from source code. Afterward, you’ll configure the VULS reps server which is the GUI interface of the VULS.
Let’s Create a new directory that contains the path to the Vuls repository, by issuing the following command:
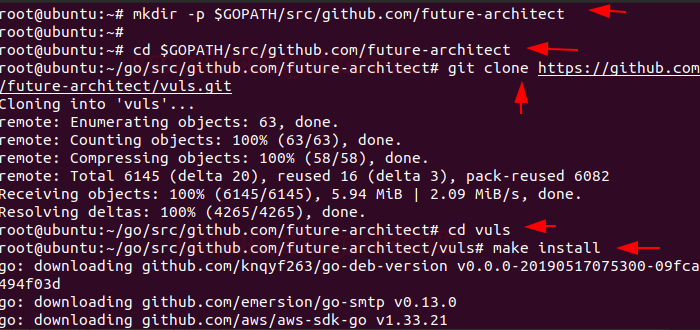
mkdir -p $GOPATH/src/github.com/future-architect
Navigate to the created directory then Clone Vuls from GitHub by running the following command:
cd $GOPATH/src/github.com/future-architect
git clone https://github.com/future-architect/vuls.git
Enter to the Package Folder and then compile and install by running the following command:
cd vuls
make install
Also, don’t forget to make it accessible globally
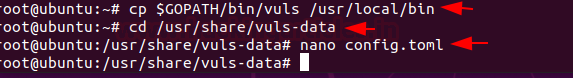
cp $GOPATH/bin/vuls /usr/local/bin
Hmm 😃 !! you have successfully installed VULS in your system
Install & Configure VULS repo server (GUI)
VulsRepo is an awesome OSS Web UI for Vuls. With VulsRepo you can analyze the scan results like Excel pivot table.
Requirements
To configure VULS in your Ubuntu platform, there are some prerequisites required for installation.
· future-architect/Vuls >= v0.4.0
· Web Browser: Google Chrome or Firefox
Installation
In manner to install Vuls-repo server in your Ubuntu platform follow the steps as stated below
Step1. Installation
Clone the vuls-repo from GitHub by running the following command:
cd $HOME
git clone https://github.com/usiusi360/vulsrepo.git
Step 2. Change the setting of vulsrepo-server
Set Path according to your environment.
cd/vulsrepo/server
cp vulsrepo-config.toml.sample vulsrepo-config.toml
nano vulsrepo-config.toml
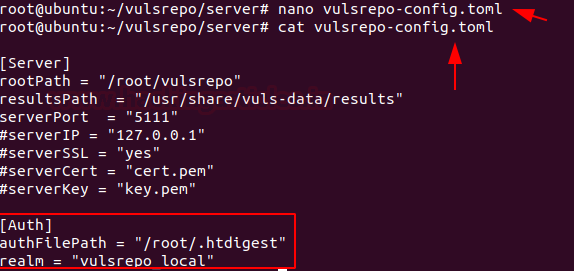
[Server]
rootPath = "/root/vulsrepo"
resultsPath = "/usr/share/vuls-data/results"
serverPort = "5111"
Step 3. Start vulsrepo-server
Start the vulsrepo-server by executing the below command under the directory
HOME/vulsrepo/server
cd/vulsrepo/server
./vulsrepo-server
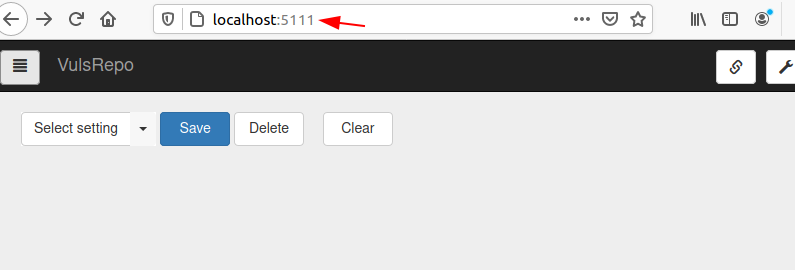
You can also verify whether it is running or not by opening the below URL, you need to make sure port 5111 is open on your server firewall and then you can access vulsrepo-server on the web interface at
http://localhost:5111
Nice 😀 !! As you can see it is successfully installed
Step 4. Always activate vulsrepo-server
In Case: SystemV (/etc/init.d)
Copy startup file. Change the variable according to the environment.
cp $HOME/vulsrepo/server/scripts/vulsrepo.init /etc/init.d/vulsrepo
chmod 755 /etc/init.d/vulsrepo
nano /etc/init.d/vulsrepo
And then make changes conf file as per your environment
In Case of: systemd (systemctl)
Copy startup file. Change the variables according to the environment.
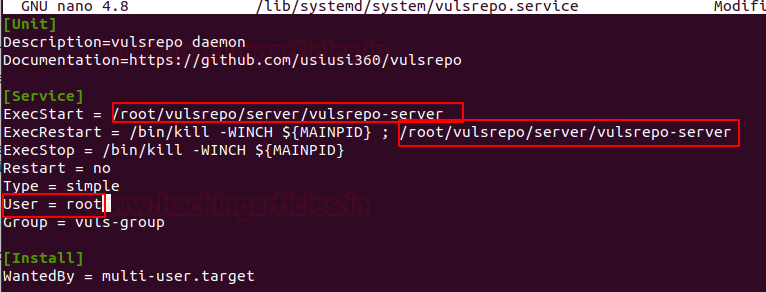
sudo cp $HOME/vulsrepo/server/scripts/vulsrepo.service /lib/systemd/system/vulsrepo.service
nano /lib/systemd/system/vulsrepo.service
And then make change in conf file as per your environment as shown below
start vulsrepo-server
systemctl start vulsrepo
Usage
Access the browser
http://<server-address>:5111
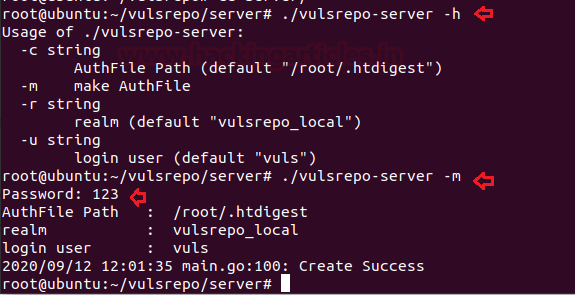
DigestAuth
create an authentication file to perform digest authentication,
./vulsrepo-server -h
./vulsrepo-server -m
Edit vulsrepo-config.toml
nano vulsrepo-config.toml
Use SSL
Create a self-signed certificate by issuing the following command
openssl genrsa -out key.pem 2048
openssl req -new -x509 -sha256 -key key.pem -out cert.pem -days 3650
Edit vulsrepo-config.toml file as shown below by running the following command
nano vulsrepo-config.toml
Start vulsrepo-server
Restart Vulsrepo-server by running the following command:
systemctl restart vulsrepo-server
And then visit the web interface, enter the login credentials that you created during the installation process to access the GUI interface. Once you logged in then you will have your VULS GUI Dashboard ready to set fire on the Vulnerability 😊.
Configuration of TOML file
Now, it’s time to create a configuration file for Vuls. Navigate back to /usr/share/vuls-data:
cd /usr/share/vuls-data
Vuls stores its configuration in a TOML file, which is config.toml. Create by issuing the following command:
nano config.toml
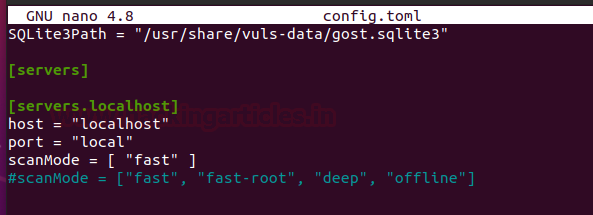
And then Enter the following configuration:
[cveDict]
type = "sqlite3"
SQLite3Path = "/usr/share/vuls-data/cve.sqlite3"
[ovalDict]
type = "sqlite3"
SQLite3Path = "/usr/share/vuls-data/oval.sqlite3"
[gost]
type = "sqlite3"
SQLite3Path = "/usr/share/vuls-data/gost.sqlite3"
[servers]
[servers.localhost]
host = "localhost"
port = "local"
scanMode = [ "fast" ]
#scanMode = ["fast", "fast-root", "deep", "offline"]
Then save and close the file.
Ok 😃 !! you have successfully created a conf.toml file
To test the validity of the configuration file, run the following command:
vuls configtest
Congratulations!! You’ve installed and configured Vuls to scan the local server on your Ubuntu Platform😉.
Running local Scan
Exited? let's do it 😁 !!
The default scan mode, if not explicitly specified, is fast.
To run a scan, execute the following command:
vuls scan
Wow !! As we can see it scanned the whole system and generated a report
Wait this is not enough… Let’s what's inside the report
To check the report on TUI (Terminal based user interface) issue the following command
vuls tui
Vuls divides the generated report view into four panels as stated below:
· Scanned hosts: located on the upper left, lists hosts that Vuls scanned.
· Found vulnerabilities: located right of the hosts list, shows the vulnerabilities that VULS found in installed packages.
· Vulnerabilities information: it is up of the left part of the screen, that shows detailed information about the vulnerability, pulled from the databases.
· Vulnerable packages: located right of the detailed information, shows the affected packages and their versions.
Aha 😵 !! It’s hilarious
Let’s check the How the GUI shows these results
Get back to the GUI Dashboard and then mark and submit the generated report that you want to view as shown below
And then see the magic 🙃 !!
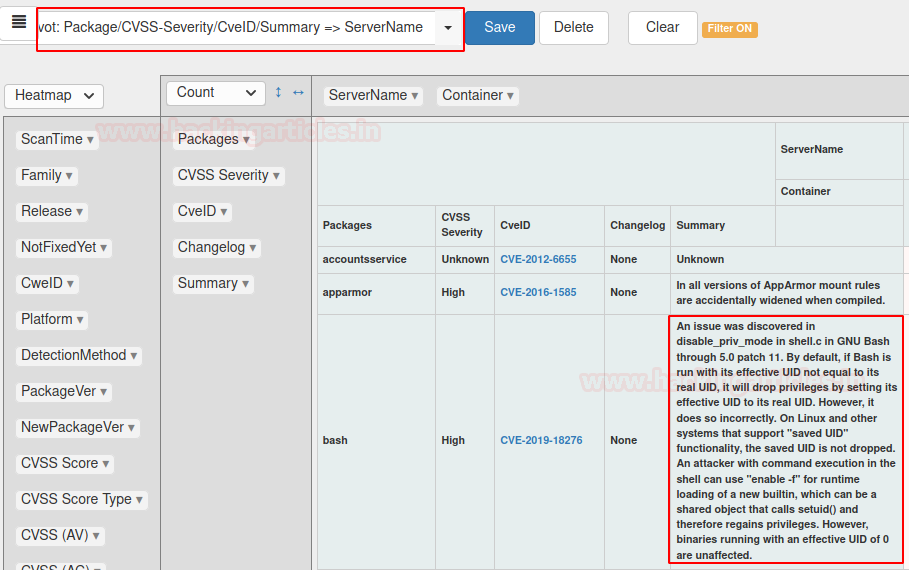
As we can see it converted to JSON report inti GUI with detailed information. By tapping on CVE ids you can more information about their vulnerability.
Also, you can filter this report as per your known by dragging the required report from the Heatmap section to Count as shown below.
Let’s make it more informative by applying filters as shown below:
Scanning Multiple remote host systems
Step 1: Enable to SSH from localhost
Vuls doesn’t support SSH password authentication. So we have to use SSH key-based authentication. Create a key pair on the localhost then copy the id_rsa.pub key to authorized_keys on the remote host.
On Localhost:
ssh-keygen -t rsa
Copy /.ssh/id_rsa.pub key to the clipboard.
And go to the Remote Host and issue the following command:
mkdir ~/.ssh
chmod 700 ~/.ssh
nano ~/.ssh/authorized_keys
and then Paste the rsa.pub key from the clipboard to ~/.ssh/authorized_keys and then follow the below steps:
chmod 600 ~/.ssh/authorized_keys
Come back to the Localhost:
And also, we need to confirm that the host keys of the remote scan target has been registered in the known_hosts of the localhost. Further, then we need to add the remote host’s Host Key to $HOME/.ssh/known_hosts, log in to the remote host through SSH before scanning.
ssh root@192.168.29.219 -i ~/.ssh/id_rsa
where 192.168.29.219 is the IP of remote Host
Step 2: Configure (config.toml) as shown below
cd /usr/share/vuls-data
nano config.toml
[servers.ignite]
host = "192.168.29.219"
port = "22"
user = "root"
keyPath = "/root/.ssh/id_rsa"
Check and verify config.toml and settings on the server before scanning:
vuls configtest
Start scanning remote host by issuing the below command:
vuls scan
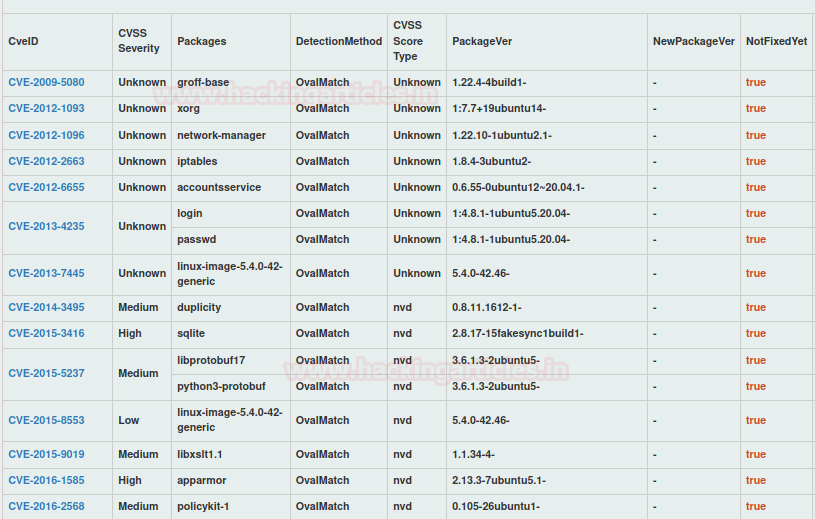
Congratulation 🙂!! As you can see you have been successfully scanned your remote host. Let’s check the generated report on the GUI dashboard.
By applying more filters, you can make you can hunt or investigate Vulnerable packages more deeper.
Let’s end Here !! 😊