The Volatility Framework is a completely open collection of tools, implemented in Python under the GNU General Public License, for the extraction of digital artifacts from volatile memory (RAM) samples. The extraction techniques are performed completely independent of the system being investigated but offer unprecedented visibility into the runtime state of the system. The framework is intended to introduce people to the techniques and complexities associated with extracting digital artifacts from volatile memory samples and provide a platform for further work into this exciting area of research.
How to use Volatility
![]()
![]()
![]()
![]()
![]()
![]()
![]()
![]()
![]()
Windows Features
Basic / Informational
· Current date, time, CPU count, CPU speed, service pack
· Current thread and idle thread
· Addresses of the KDBG, KPCR, DTB, PsActiveProcessHead, PsLoadedModuleList, etc
Processes
· List active processes (column or tree view)
· Scan for hidden or terminated _EPROCESS objects (using pool tags or _DISPATCHER_HEADER)
· Enumerate DLLs in the PEB LDR lists
· Rebuild/extract DLLs or EXEs to disk based on name, base address, or physical offset
· Print open handles to files, registry keys, mutexes, threads, processes, etc
· List security identifiers (SIDs) for processes
· Scan for cmd.exe command history and full console input/output buffers
· List process environment variables
· Print PE version information from processes or DLLs (file version, company name, etc)
· Enumerate imported and exported API functions anywhere in process or kernel memory
· Show a list of virtual and physical mappings of all pages available to a process
· Dump process address space to disk as a single file
· Analyze Virtual Address Descriptor (VAD) nodes, show page protection, flags, and mapped files
· Represent the VAD in tree form or Graphviz .dot graphs
· Dump each VAD range to disk for inspecting with external tools
· Parse XP/2003 event log records
Kernel Memory
· List loaded kernel modules and scan for hidden/unloaded module structures
· Extract PE files including drivers from anywhere in kernel memory
· Dump the SSDT for all 32- and 64-bit windows systems
· Scan for driver objects, print IRP major function tables
· Show devices and device tree layout
· Scan for file objects (can show deleted files, closed handles, etc)
· Scan for threads, mutex objects and symbolic links
GUI Memory
· Analyze logon sessions and the processes and mapped images belonging to the session
· Scan for window stations and clipboard artifacts (clipboard snooping malware)
· Scan for desktops, analyze desktop heaps and attached GUI threads
· Locate and parse atom tables (class names, DLL injection paths, etc)
· Extract the contents of the windows clipboard
· Analyze message hooks and event hooks, show the injected DLL and function address
· Dump all USER object types, pool tags, and flags from the gahti
· Print all open USER handles, associated threads or processes, and object offsets
· Display details on all windows, such as coordiates, window title, class, procedure address, etc
· Take screen shots from memory dumps (requires PIL)
Malware Analysis
· Find injected code and DLLs, unpacker stubs, and decrypted configurations, etc
· Scan process or kernel memory for any string, regular expression, byte pattern, URL, etc
· Analyze services, their status (running, stopped, etc) and associated process or driver
· Cross-reference memory mapped executable files with PEB lists to find injected code
· Scan for imported functions in process or kernel memory (without using import tables)
· Detect API hooks (Inline, IAT, EAT), hooked winsock tables, syscall hooks, etc
· Analyze the IDT and GDT for each CPU, alert on hooks and disassemble code
· Dump details of threads, such as hardware breakpoints, context registers, etc
· Enumerate kernel callbacks for process creation, thread creation, and image loading
· Display FS registration, registry, shutdown, bugcheck, and debug print callbacks
· Detect hidden processes with alternate process listings (6+ sources)
· Analyze kernel timers and their DPC routine functions
Networking
· Walk the list of connection and socket objects for XP/2003 systems
· Scan physical memory for network information (recover closed/terminated artifacts)
· Determine if listening sockets are IPv4, IPv6, etc and link to their owning processes
· Registry
· Scan for registry hives in memory
· Parse and print any value or key cached in kernel memory, with timestamps
· Dump an entire registry hive recursively
· Extract cached domain credentials from the registry
· Locate and decrypt NT/NTLM hashes and LSA secrets
· Analyze user assist keys, the shimcache, and shellbags
· Crash Dumps, Hibernation, Conversion
· Print crash dump and hibernation file header information
· Run any plugin on a crash dump or hibernation file (hiberfil.sys)
· Convert a raw memory dump to a crash dump for opening in !WinDBG
· Convert a crash dump or hibernation file to a raw memory dump
Miscellaneous
· Link strings found at physical offsets to their owning kernel address or process
· Interactive shell with disassembly, type display, hexdumps, etc
How to use Volatility
Before you can conduct victim system analysis you need to capture memory.
Step3: Now Open Volatility from command prompt and use the Following Commands
Imageinfo
If you don't know what type of system your image came from, use the imageinfocommand
volatility.exe –f (Windows Dump Path) imageinfo

pslist
To list the processes of a system, use the pslist command. This walks the doubly-linked list pointed to by PsActive Process Head. It does not detect hidden or unlinked processes.
volatility.exe –f (Windows Dump Path) pslist

psscan
To enumerate processes using pool tag scanning, use the psscan command. This can find processes that previously terminated (inactive) and processes that have been hidden or unlinked by a rootkit.
volatility.exe –f (Windows Dump Path) psscan

dlllist
To display a process's loaded DLLs, use the dlllist command. It walks the doubly-linked list of LDR_DATA_TABLE_ENTRY structures which is pointed to by the PEB's In Load Order Module List. DLLs are automatically added to this list when a process calls LoadLibrary (or some derivative such as LdrLoadDll) and they aren't removed until Free Library is called and the reference count reaches zero.
volatility.exe –f (Windows Dump Path) dlllist

getsids
To view the SIDs (Security Identifiers) associated with a process, use the getsids command. Among other things, this can help you identify processes which have maliciously escalated privileges.
volatility.exe –f (Windows Dump Path) getsids

sockets
To detect listening sockets for any protocol (TCP, UDP, RAW, etc), use the sockets command. This walks a singly-linked list of socket structures which is pointed to by a non-exported symbol in the tcpip.sys module. This command is for Windows XP and Windows 2003 Server only.
volatility.exe –f (Windows Dump Path) sockets

hivelist
To locate the virtual addresses of registry hives in memory, and the full paths to the corresponding hive on disk, use the hivelist command.
volatility.exe –f (Windows Dump Path) hivelist

userassist
To get the UserAssist keys from a sample you can use the userassist plugin.
volatility.exe –f (Windows Dump Path) userassist

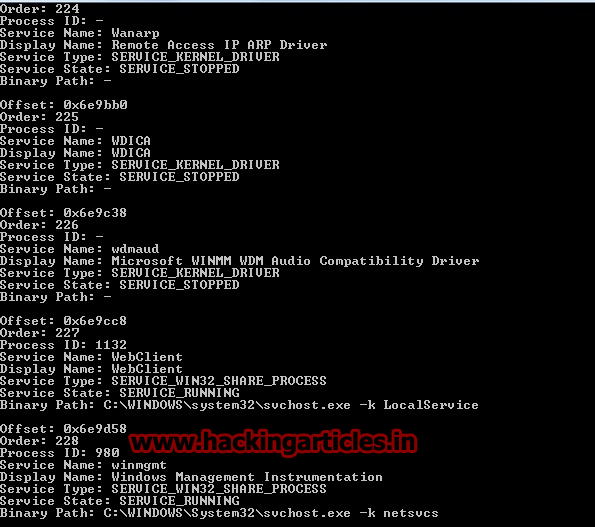
svcscan
Volatility is the only memory forensics framework with the ability to list Windows services. To see which services are registered on your memory image, use the svcscan command. The output shows the process ID of each service (if its active and pertains to a usermode process), the service name, service display name, service type, and current status. It also shows the binary path for the registered service - which will be an EXE for usermode services and a driver name for services that run from kernel mode
volatility.exe –f (Windows Dump Path) svcscan
Command Reference & More Commands Visit: